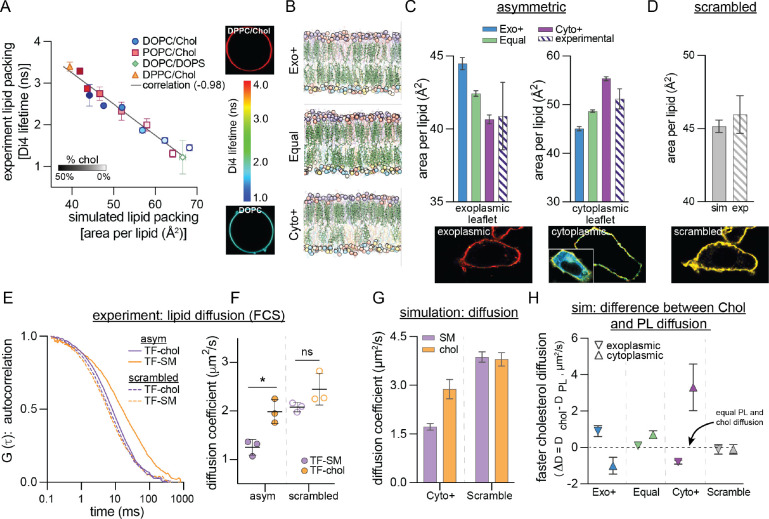
Fig. 4. Experimental validation of Cyto+ model.
(A) Calibration of Di4 lifetime, an experimental reporter of lipid packing measured in giant unilamellar vesicles (GUVs), with simulated area-per-lipid (APL) across a set of synthetic symmetric bilayers. Shown is average ± SD of individual experiments. Representative images of the least and most tightly packed GUVs are shown on the right. Color bar indicates Di4 lifetime. Light- to dark-filled symbols represent increasing mol% of cholesterol. (B) Snapshots of three simulated PM models having more PLs in their exoplasmic (top) or cytoplasmic (bottom) leaflets, or similar numbers of PLs in both leaflets (middle). Lipid representation is the same as in Figure 1E. (C) Leaflet packing densities (area per lipid) from the three simulated PM models with different interleaflet PL abundances from (B) compared to experimental measurements in PMs of live fibroblasts. (D) APL of the scrambled Cyto+ model compared to the experimentally scrambled fibroblast PM (via ionophore treatment). Representative images at bottom of C-D are of Di4 lifetime in the PM of fibroblast cells (color scale for lifetime shown in panel A). ‘Cytoplasmic’ panel shows the masked PM of a microinjected cell with full image as an inset. (E) Representative FCS curves for TF-SM and TF-chol in the PM of live fibroblasts before (asym) and after (scrambled) ionophore treatment. (F) Corresponding diffusion coefficients of TF-SM and TF-chol calculated from FCS measurements. Data points represent means of three biologically independent replicates, each with >5 cells and >5 measurements per cell; thus, each point is the average of >25 FCS curves. (G) Diffusion coefficients of SM and cholesterol (chol) in the simulated Cyto+ membrane (left) and its scrambled counterpart (right). Cholesterol diffusion in Cyto+ represents the asymmetry-weighted average of the slowly diffusing population in the exoplasmic leaflet and the rapidly diffusing population in the cytoplasmic leaflet (Figure S13A). (H) Difference between cholesterol and phospholipid diffusion (ΔD) in each leaflet of the simulated asymmetric PM models and the Cyto+ scrambled membrane. *p<0.01. All simulations shown in this figure are all-atom.

