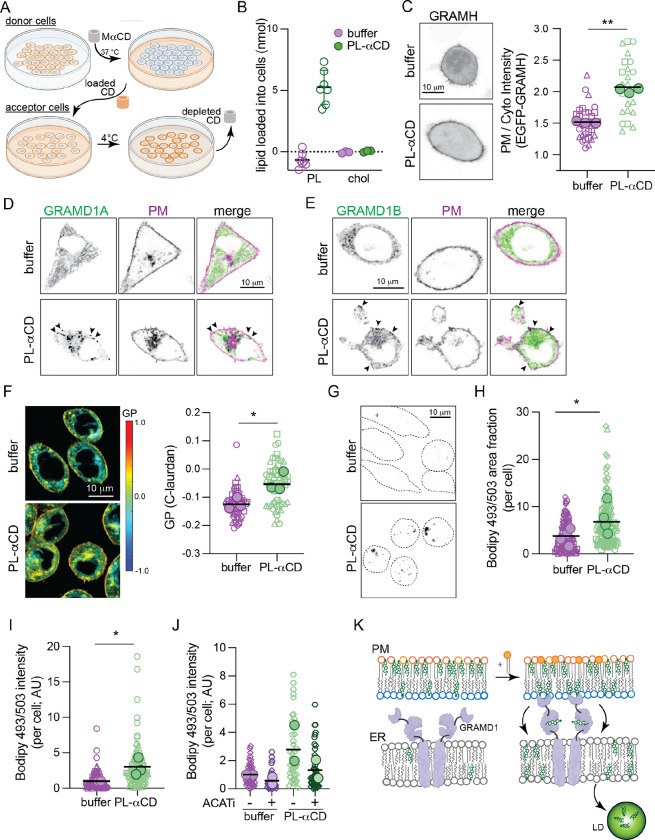
Fig. 7. Cholesterol homeostasis is regulated by PM transbilayer phospholipid distribution.
(A) Schematic of PL loading into the PM outer leaflet of target cells via MαCD extraction of PL and loading onto fresh cells. (B) Quantification of PL and Chol loading into ~3 × 10⁵ RBLs via PL-MaCD. (C) EGFP-GRAMH localization in cells treated with PL-MaCD; representative images on left, quantification on right. (D) EGFP-GRAMD1A and (E) EGFP-GRAMD1B localization in cells treated with PL-MaCD (co-expressing a PM marker, magenta). Arrowheads denote GRAM protein puncta at the PM induced by PL-MaCD. (F) Left, C-laurdan GP maps of cells treated with PL-MaCD. Warm colors represent higher GP (i.e. tighter lipid packing). Right, quantification of GP of internal membranes. (G) Bodipy 493/503 staining of cells treated with PL-MaCD. Representative confocal max projection images. (H) Quantification of area fraction with Bodipy staining per cell. (I) Quantification of total Bodipy intensity per cell. (J) Quantification of Bodipy 493/503 intensity in cells treated with PL-MaCD with and without ACAT inhibition (1 ug/mL Sandoz 58–035). (K) Schematic of cholesterol translocation from the outer leafler of the PM to lipid droplets when phospholipids are loaded to the outer leaflet. In C, F, H, I, and J small symbols represent individual cells, with symbol shapes denoting independent experiments. Filled larger symbols are means of independent experiments. Paired t-test on means of independent experiments; p< 0.05, p<0.01.

