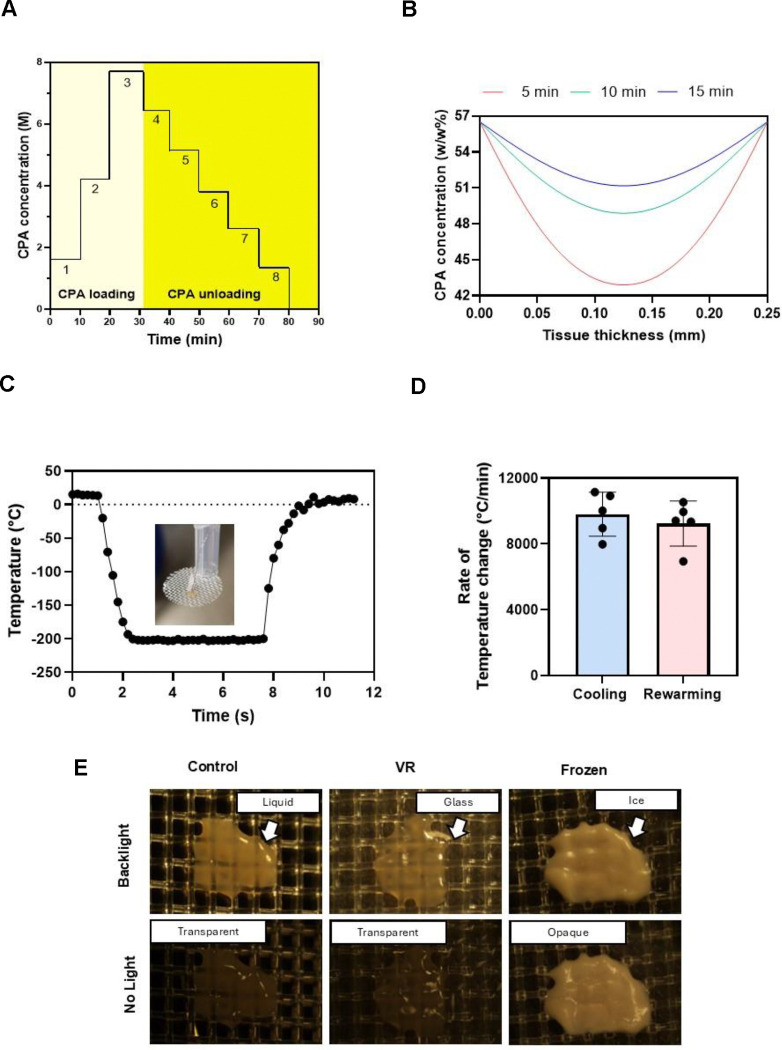
Fig. 2. Vitrification characteristics of PCLS.
(A) The CPA loading and unloading profile was an initial three steps of EG followed by a final step of 40% (v/v) EG and 0.6M Sucrose. Post vitrification, we unloaded the CPA in six steps of decreasing sucrose concentration and a final carrier solution-only step. (B) The COMSOL model estimated the total CPA concentration throughout the tissue following loading steps of 5, 10, and 15 minutes. (C) Representative thermometry of the PCLS taken during vitrification and rewarming on the cryomesh. Inset is a picture of the thermometry setup. (D) Cooling and rewarming rates measured from thermometry. (E) Visualization of ice in the PCLS. Control and VR are transparent, indicating no ice, and the frozen slice is opaque due to ice formation. CPA, cryoprotective agent; VR, vitrification and rewarming.

