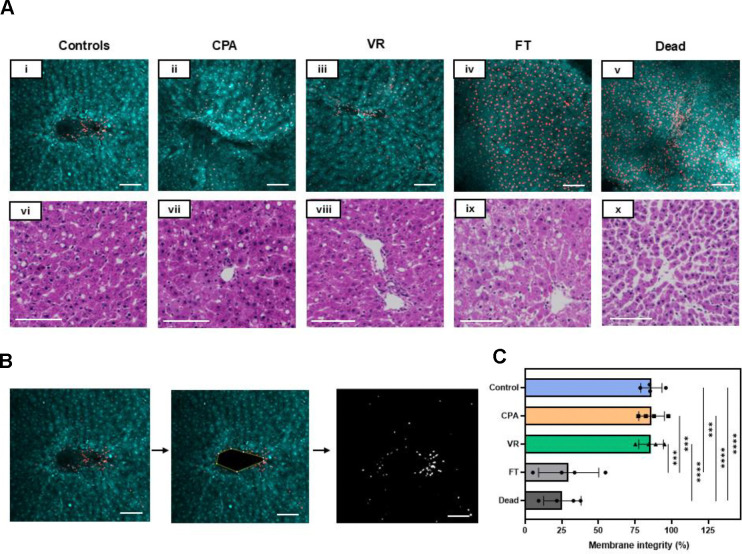
Fig. 3. Viability and tissue morphology directly post cryopreservation.
(A) (i-v) AO/PI staining where AO-stained cells appear green, and the PI-stained cells are red, indicating cell membrane compromise. (vi-x) H&E staining of the slice groups just post rewarming. (B) The viability through membrane integrity was assessed by analyzing the number of dead cells in the given z-plane by assessing areas of individual cells and comparing the number of PI quenched cells to the total number of cells. (C) Viability measure from AO/PI for each group. Levels of significance: ***, p =0.0001; ****, p <0.0001 (One-way ANOVA). AO, acridine orange; CPA, cryoprotective agent; FT, slow freezing and rapid thawing; H&E, hematoxylin and eosin; PI, propidium iodide; VR, vitrification and rewarming.

