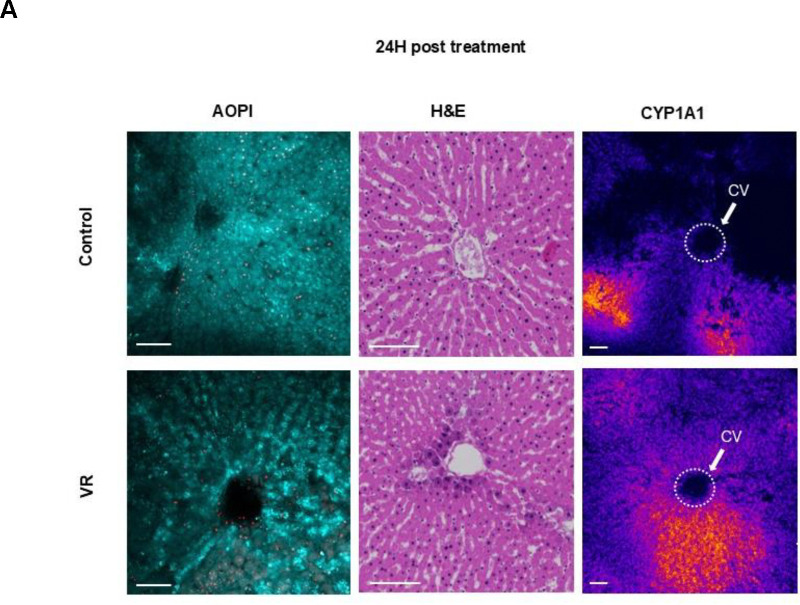
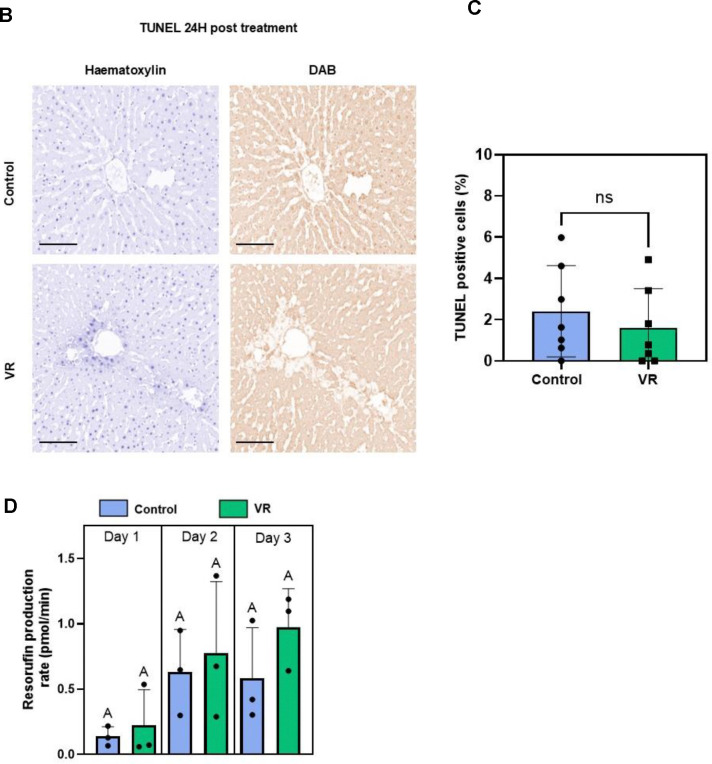
Fig. 5. Acute injury response of slices and quantified enzymatic activity.
(A) Acute evaluation of PCLS with AO/PI, H&E staining, and CYP1A1 zonated activity. (B) TUNEL staining after 24h culture to evaluate apoptosis (or necrosis) in both groups. Hematoxylin staining (blue) shows all nuclei and DAB stain (brown) shows TUNEL positive nuclei. (C) Quantification of TUNEL-positive cells (n=7). (D) Rates of resorufin production (N=3, n=4). The level of significance is presented by compact letter display (Kruskal-Walli’s test). AO, acridine orange; CYP1A1, Cytochrome P450 1A1; H&E, hematoxylin and eosin; PI, propidium iodide; VR, vitrification and rewarming; CV, central vein.


