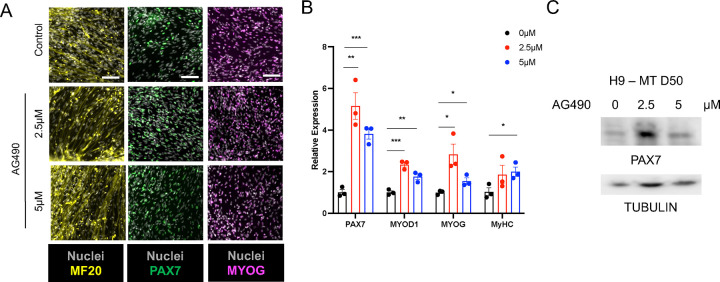
Figure 3: Increased myogenic differentiation upon AG490 removal.
A. Representative images of MF-20 (yellow), PAX7 (green) and MYOG (magenta) at D50 of differentiation, nuclei are counterstained with Hoechst (gray). Scale bar 100 μm for MF-20, 50 μm for PAX7 and MYOG.
B. qPCR analysis of myogenic factors (PAX7, MYOD1, MYOG, and MyHC) expression at D50 of differentiation.
C. Western blot analysis of whole cell lysate of H9-derived myogenic cultures treated with AG490 using a-PAX7, and anti-Tubulin antibodies
N=3 biological replicates.
ns. p > 0.05 ; *. p≤ 0.05 ; **. p≤ 0.01 ; ***. p≤ 0.001 unpaired Student’s t test.

