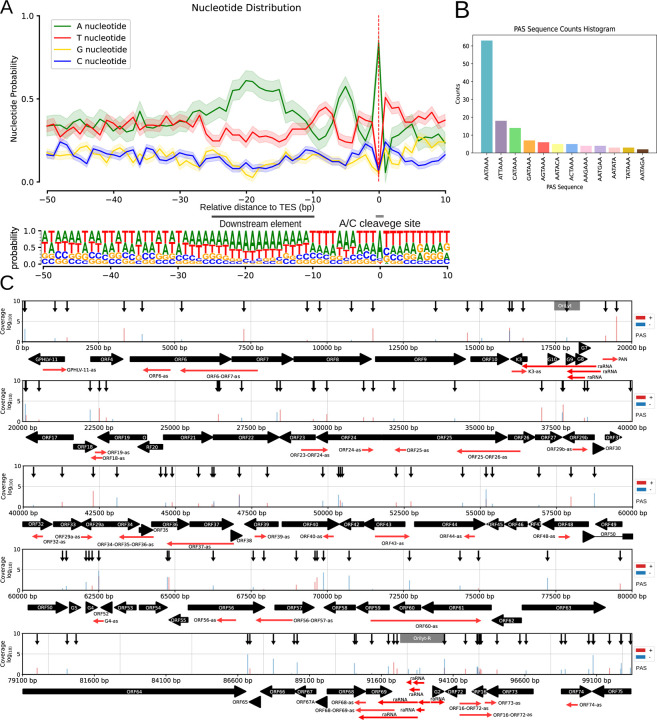
Figure 3. Characterization and distribution of the 3’-ends of CaGHV-1 transcripts.
(A) The nucleotide probability distribution within the −50 to +10 base pair region surrounding the transcription end sites (TESs). TESs are characterized by the presence of the eukaryotic A/C cleavage site and G/U-rich sequence motifs downstream. (B) The distribution of canonical eukaryotic TATA boxes identified in TSSs by the LoRTIA program. (C) The gray lines show the distribution of TSSs across the viral genome as identified by LoRTIA, with line sizes corresponding to TSS counts on a logarithmic scale (Log₁₀). Black vertical arrows mark the annotated TATA boxes, black horizontal arrows indicate gene ORFs, and green horizontal arrows represent replication origin-associated RNAs (raRNAs) as well as antisense (as) RNA molecules.

