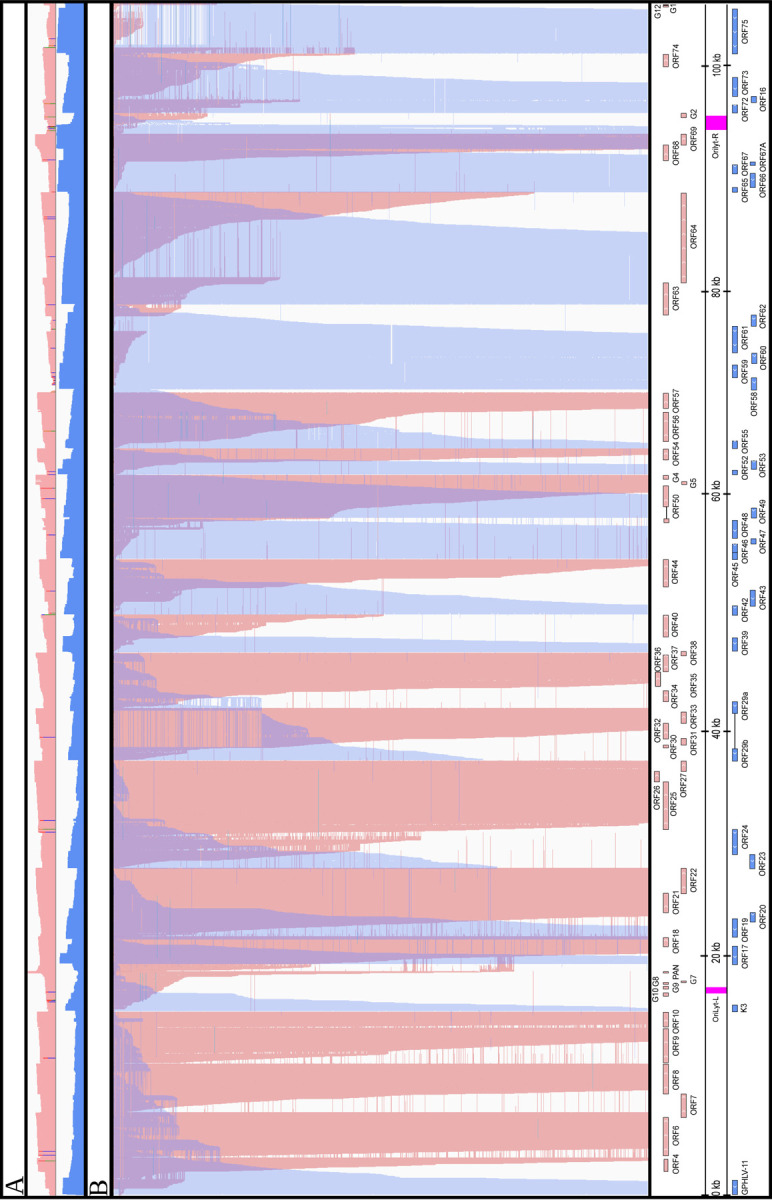
Figure 6. Overlaps of raw dRNA Reads.

(A) The upper coverage plot shows the transcriptional activity of the viral genome, indicating that both DNA strands are transcriptionally active across the entire genome. Coverage values are plotted on a Log₁₀ scale, with red representing the positive strand and blue representing the negative strand. (B) This panel highlights an extremely complex meshwork of transcriptional overlaps formed by genes arranged in head-to-head (divergent) and tail-to-tail (convergent) orientations. We hypothesize strong interference between the transcriptional machineries at the overlapping regions, which may represent a novel layer of gene regulation.
