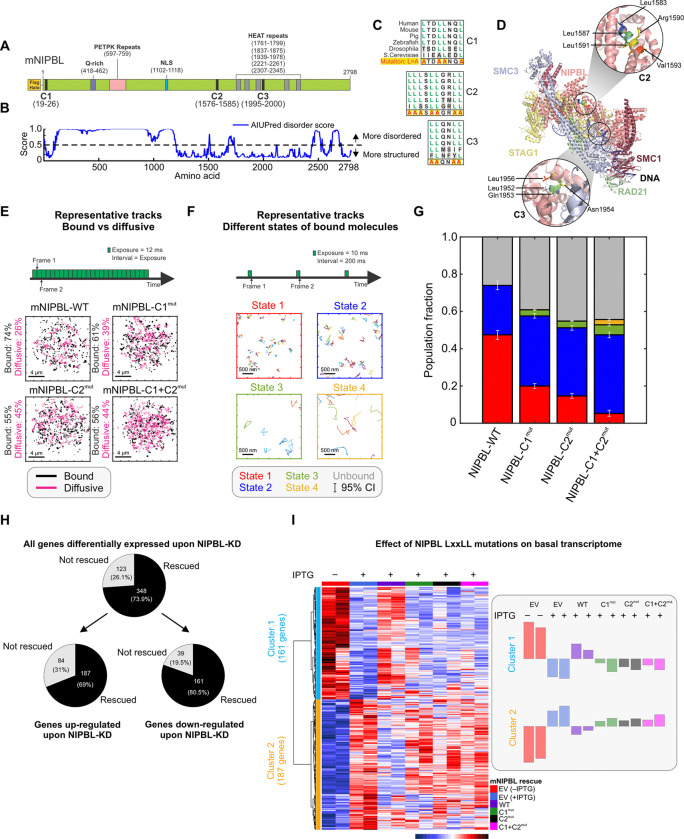
Figure 1: LxxLL mutations alter NIPBL dynamics and basal transcriptome.
(A) Domain organization of Mus musculus NIPBL (mNIPBL) including the ectopic FLAG-Halo protein tags at the N-terminus of the protein. The three annotated LxxLL motif clusters are indicated as C1, C2, and C3. (B) AIUPred disorder score for mNIPBL. (C) Conservation of NIPBL LxxLL motif clusters across species. (D) Overall structure of the human cohesin-NIPBL-DNA complex solved by cryo-EM23. The C2 and C3 clusters are indicated in the insets. (E) Fast SMT protocol (top) and 500 randomly selected single molecule trajectories for indicated species (bottom). Bound and diffusive fractions are indicated on the left of the respective panels. Scale bar is 4 μm. Ncells/Ntracks = 70/15,394 (WT), 142/82,691 (C1mut), 76/46,879 (C2mut), 75/27,535 (C1+C2mut). (F) Intermediate SMT protocol captures the motion of bound NIPBL molecules (top). Representative trajectories of molecules in each of the four detected mobility states (bottom). Scale bar is 500 nm. Ncells/Ntracks/Nsub-tracks = 53/1,496/7,004 (WT), 65/5,769/19,632 (C1mut), 69/4,398/22,317 (C2mut), 67/1,746/7,729 (C1+C2mut). (G) Population fractions for indicated mNIPBL species. Error bars = 95% confidence interval. (H) Differentially expressed genes upon NIPBL-KD rescued by 3xFLAG-Halo-mNIPBL-WT expression under basal conditions. (I) (Left) Heatmap of the 348 genes rescued by ectopic 3xFLAG-Halo-NIPBL-WT compared across the cell lines. (Right) Average expression bar plots for the genes in each cluster. See also, Figure S1, Videos S1–S2.

