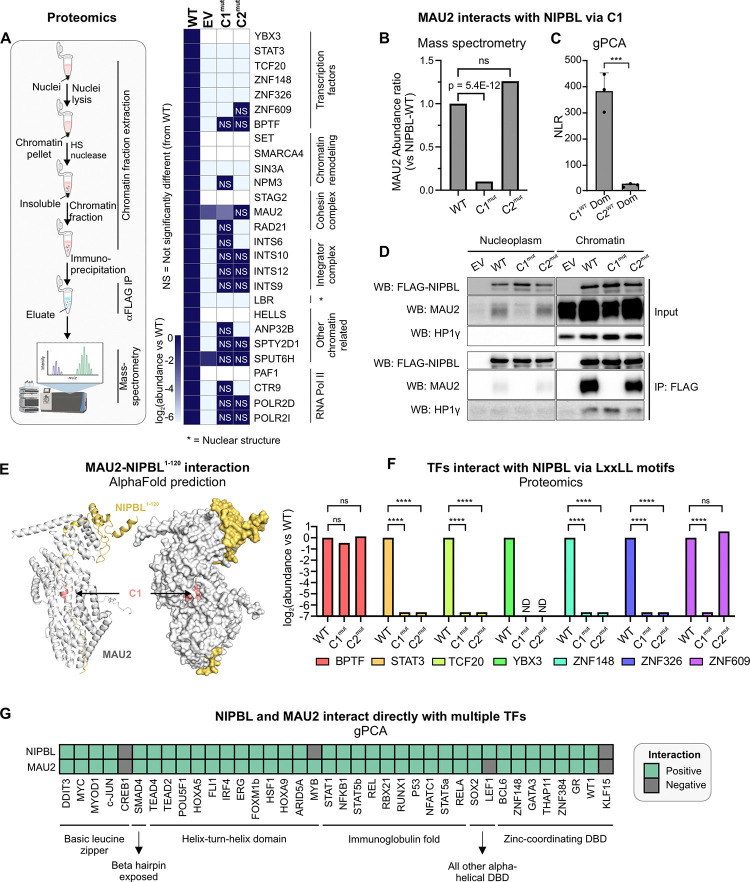
Figure 2: Leu-rich clusters recruit diverse chromatin-associated proteins.
(A) (Left) Schematic representation of the proteomics experiments. (Right) Heatmap of abundance ratio of peptides detected in WT vs indicated NIPBL mutants. (B) MAU2 abundance detected in NIPBL-C1mut and C2mut relative to WT. p-value is reported from a one-way ANOVA. (C) NLRs for MAU2 against mNIPBL-C1WT and mNIPBL-C2WT domains. Error bars denote standard deviation. ***p<0.001 (paired t-test). (D) Co-immunoprecipitation of MAU2 with NIPBL-WT, C1mut, and C2mut using the anti-FLAG antibody. (E) AlphaFold2-Multimer prediction of mNIPBL1–120 (yellow) with mMAU2 (silver). C1 is indicated in salmon. (F) Mass-spec log2(abundance ratio: C1mut/C2mut vs WT) of selected TFs. ****p<0.001 (one-way ANOVA). (G) Heatmap of gPCA interactions of NIPBL and MAU2 against a panel of TFs. See also, Figure S2.

