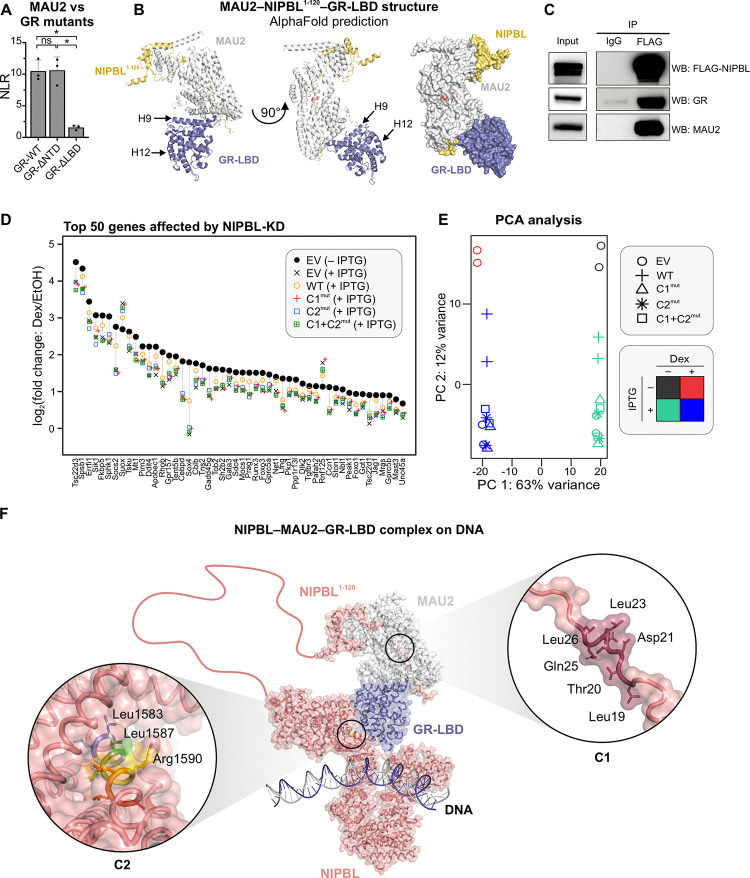
Figure 4: GR forms a ternary complex with NIPBL/ MAU2 with implications for glucocorticoid signaling.
(A) gPCA results of MAU2 against GR-WT, GR-ΔNTD, and GR-ΔLBD. *p<0.05 (one-way ANOVA followed by Tukey test). Error bars denote the standard deviation. (B) AlphaFold2-Multimer prediction of the composite structure of mMAU2-mNIPBL1–120-mGR-LBD. (C) Triple-IP of FLAG-NIPBL, MAU2, and GR in cl15-WT cells. (D) Scatter plot of the top-50 genes whose Dex-response is affected upon NIPBL-KD. (E) PCA plot of the RNA-seq data across multiple conditions presented in Figures 1 and 4. (F) Superposition of the predicted AlphaFold2-Multimer structure for NIPBL1–120-MAU2-GR-LBD and the docking prediction for NIPBL-GR-LBD. Insets: Zoomed in structure of the C1 (right) and C2 (left) clusters. See also, Figure S4.

