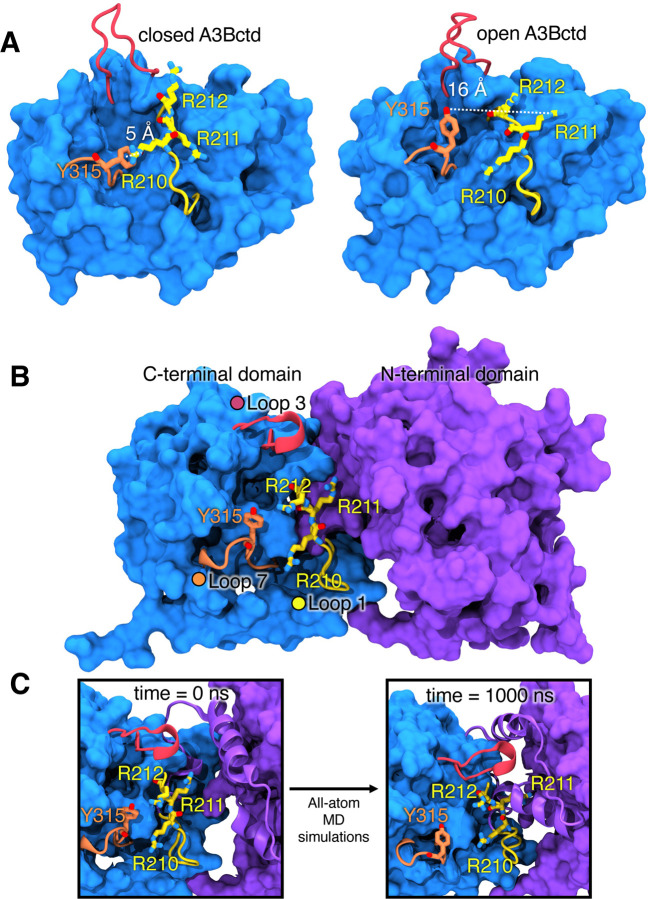
Figure 2.
A3Bctd X-ray structures and fl-A3B model. (A) Representative structures of open and closed-state A3Bctd from available PDB X-ray structures (with ssDNA bound, not shown, from PDB ID 5TD5).3 The closed A3Bctd active site is defined with a 5 Å distance between R211-Y315. An open A3Bctd active site is defined with 16 Å distance between R211-Y315. (B) fl-A3B model. (C) Conformational dynamics of fl-A3B ssDNA active site, in loop 1, residues R210, R211, and R212 interacting with N-terminal domain.

