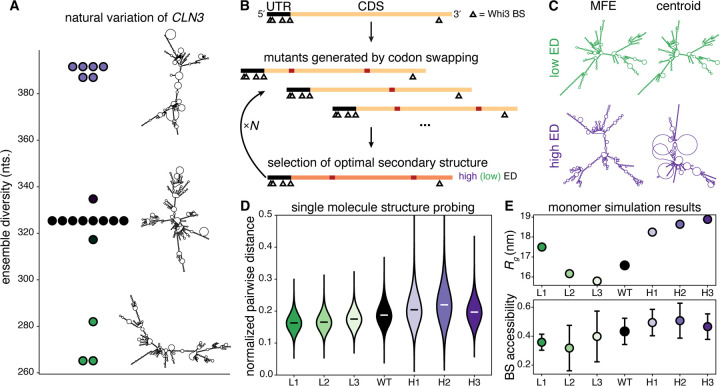
Figure 1: Design of RNA structural ensembles.
(A) CLN3 mRNAs in Ashbya gossypii wild isolates have different sequences and sample a range of predicted ensemble diversities (ED). Representative centroid structures are shown to the right of the plot points. (B) Top: A schematic of the CLN3 transcript is shown in which the lengths of the 5′ UTR and the coding sequence (CDS) and the positions of the Whi3 binding sites (BS) are drawn to scale. Middle: Several mutant sequences are generated by random synonymous mutations within the CDS by swapping codons subject to the constraints described in the text. Bottom: The mutant sequence with the maximum (minimum) predicted ED is chosen as the parent of the next generation. This process is iterated N times until a sequence with desired properties is found. (C) Secondary structure predictions of the minimum free energy (MFE) and centroid structures from designed sequences L3 (top) and H3 (bottom) at 25°C and 150mM NaCl are shown. (D) The normalized pairwise distances among the longest 1000 reads for each sequence are shown. White and black bars represent medians. All distributions are significantly different based on the Mann-Whitney U test with p < 0.01. (E) Top: Predicted radius of gyration (Rg) from simulations for each sequence. Error bars are smaller than markers. Bottom: Predicted average Whi3 binding site (BS) solvent accessibility from simulations for each sequence. Error bars represent standard deviations of accessibility among the 5 BS for each sequence.

