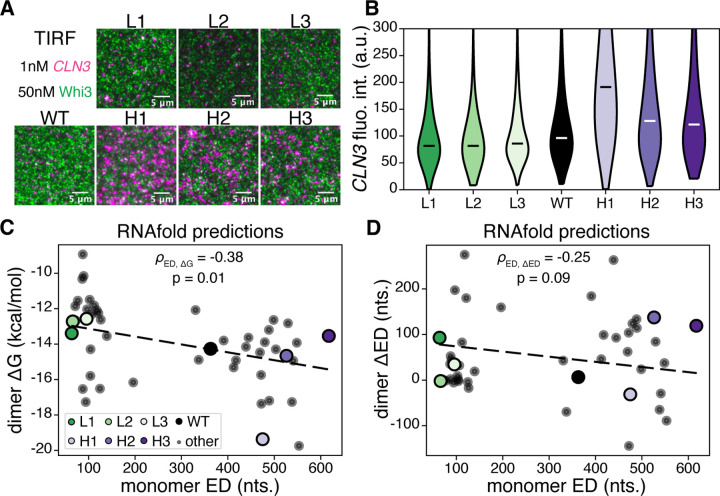
Figure 2: RNA ED controls composition of subsaturated RNA-protein assemblies.
(A) Total internal reflection fluorescence (TIRF) microscopy was performed to visualize subsaturated clusters of CLN3 structural mutants and Whi3 protein. Magenta corresponds to CLN3, and green corresponds to Whi3. Scale bars are 5μm. (B) Distributions of puncta intensities from the data represented in panel (A) are shown. White and black bars indicate medians. All distributions are significantly different based on the Mann-Whitney U test with p < 0.01. (C) RNAfold predictions of dimer ΔG, defined in the text, versus monomer ED, for the CLN3 structure mutants and 40 additional designed sequences (“other” in legend) are shown. ρED,ΔG is the Pearson’s correlation coefficient, and p is the associated p-value. (D) The same sequences are analyzed as in (C) but for dimer ΔED and monomer ED. ρED,ΔED is the Pearson’s correlation coefficient between monomer ED and dimer ΔED.

