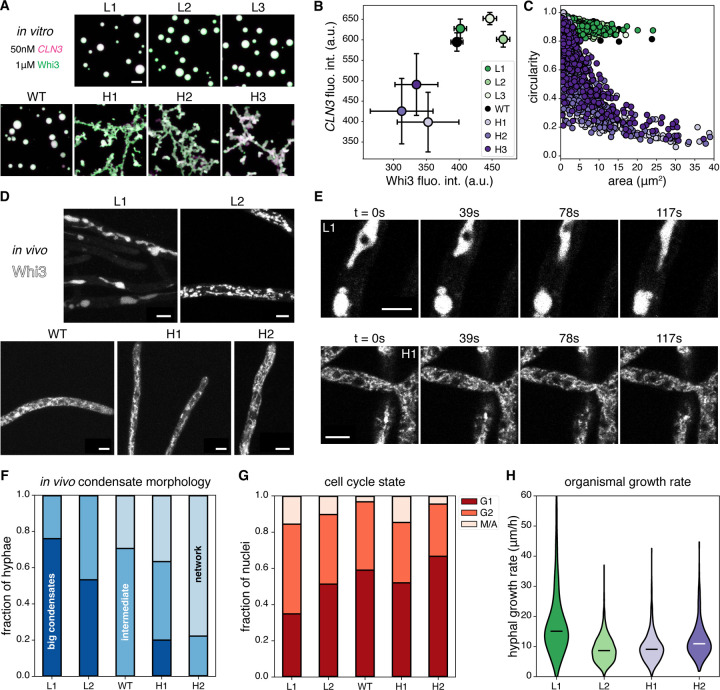
Figure 3: Upon phase separation, RNA ED encodes condensate material properties and can alter cell physiology.
(A) Images are maximum z-projections of condensates formed by incubating 50nM of each CLN3 structure mutant with 1μΜ Whi3 for 5 hours at 25°C. Green corresponds to Whi3 and magenta corresponds to CLN3. Each channel is contrasted identically in all images. All scale bars throughout this figure correspond to 5μm. (B) The central regions of the largest 50 condensates from experiments corresponding to panel (A) are used to estimate dense phase fluorescence intensities for Whi3 and CLN3 (see Methods and Fig S13). Fluorescence intensities have been divided by 100. Error bars represent standard deviations. (C) The circularity is plotted against the area of each condensate from experiments corresponding to panel (A). (D) Images are maximum z-projections of Whi3-tdTomato in Ashbya strains with the indicated CLN3 structural mutants integrated into the genome. Each image is contrasted separately to aid visualization. (E) Images corresponding to the indicated times from time lapses of Whi3 in the L1 (top) and H1 (bottom) Ashbya strains are shown. Circular black regions of exclusion correspond to nuclei. Each image is a single z-slice, and each row is contrasted separately to aid visualization. (F) Hyphae in images from experiments corresponding to panel (D) were categorized as belonging to 1 of 3 categories: “big condensates” as shown in the L1 image in panel (D), “intermediate” as shown in the L2 and WT images in panel (D), or “network” as shown in the H1 and H2 images in panel (D). The total numbers of categorized hyphae for each CLN3 mutant Ashbya strain are L1 (75), L2 (30), WT (17), H1 (60), and H2 (18). (G) Spindle pole body and nuclei staining were performed on fixed Ashbya cells from which nuclear division states were determined (see Fig S15). The total numbers of categorized nuclei for each CLN3 mutant Ashbya strain are L1 (109), L2 (39), WT (61), H1 (150), and H2 (66). (H) Hyphal growth rates were measured for each of the indicated CLN3 mutant Ashbya strains. Black and white bars represent medians. The total numbers of measured hyphae are L1 (672), L2 (681), H1 (895), and H2 (675). All distributions are significantly based on the Mann-Whitney U test with p < 0.01, except for L2 and H1 which are different with p = 0.048.

