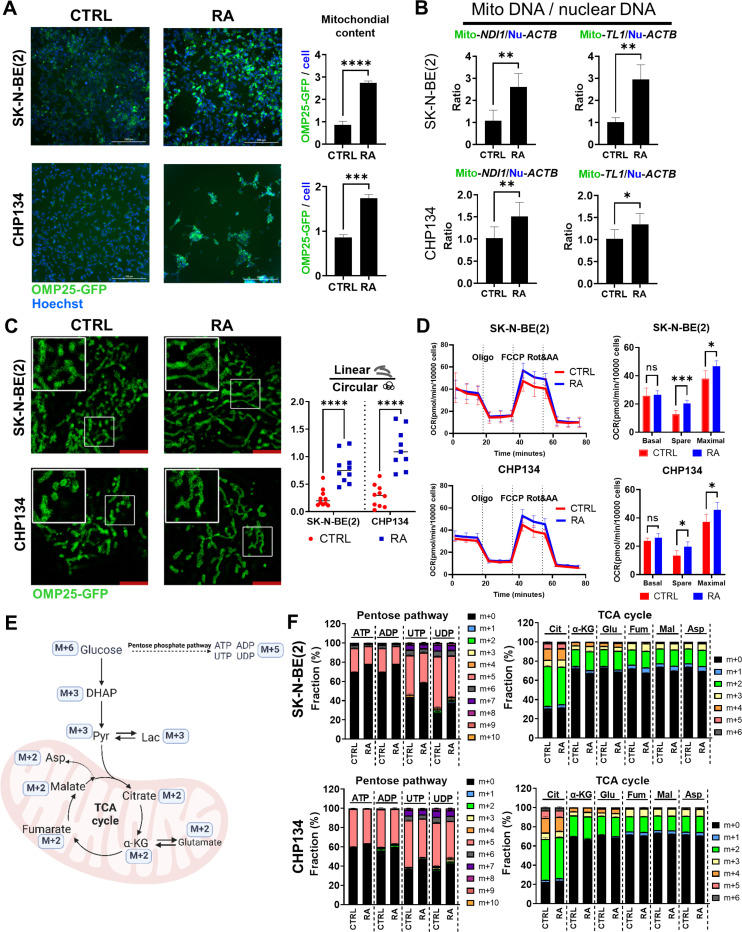
Figure 1. RA increased mitochondrial quantity without activating mitochondrial respiration.
(A) SK-N-BE(2) and CHP134 cells stably expressing 3XHA-OMP25-GFP (green) were treated with DMSO (CTRL) or 1 μM RA for 72 hours. Hoechst dye (blue) was used to stain nuclei, and the GFP signal was normalized to the number of Hoechst-stained nuclei. (B) The mitochondrial DNA (mtDNA) to nuclear DNA ratio was quantified using qPCR by analyzing the mitochondrial genes ND1 and TL1, normalized to the nuclear gene ACTB. (C) Mitochondrial morphology was visualized via confocal microscopy with a 63x oil lens and 2x zoom, with linear and circular mitochondria analyzed using ZEN 3.9 software. (D)Mitochondrial function was assessed through Seahorse assays, measuring basal, spare, and maximal OCR. (E) A schematic of U-13C-glucose tracing. (F) Glucose labeling fractions in the pentose phosphate pathway and TCA cycle metabolites were measured by LC-MS.

