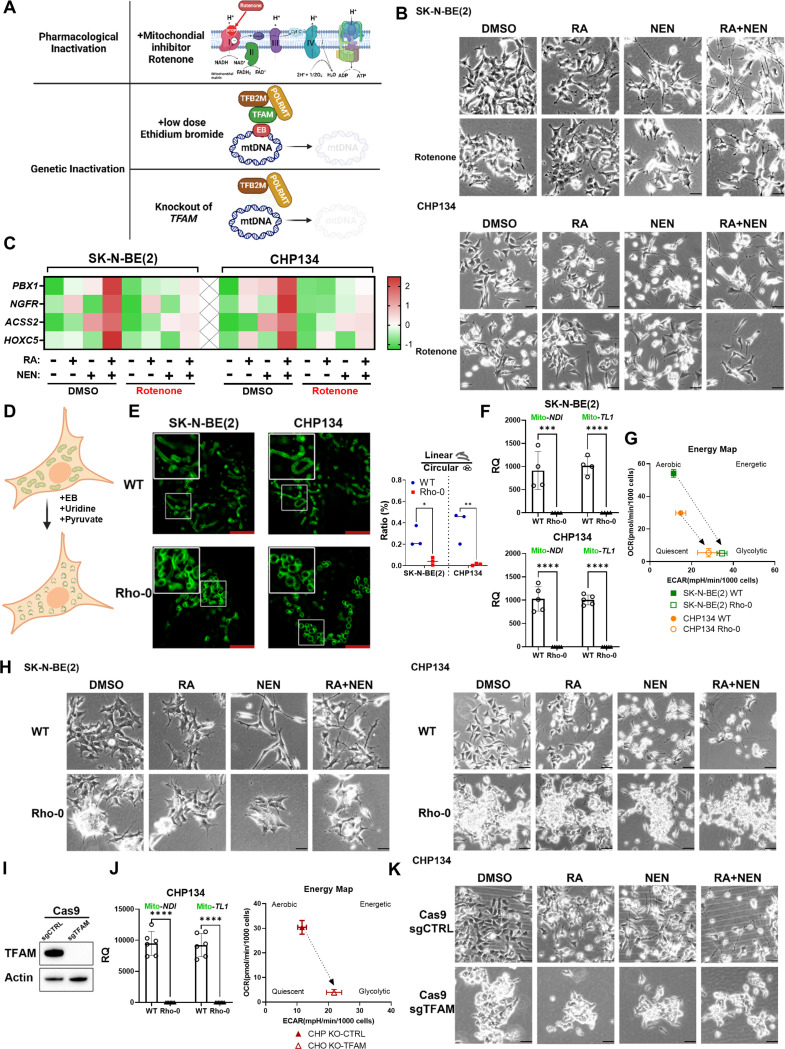
Figure 4. Mitochondrial respiration is essential for neuroblastoma differentiation.
(A) Schematic illustrating three methods of mitochondrial inactivation. Pharmacological inactivation is achieved by Rotenone, a complex I inhibitor that disrupts the electron transport chain. Genetic inactivation includes low-dose ethidium bromide (EB), which inhibits mitochondrial DNA (mtDNA) replication by interfering with TFAM, TFB2M, and POLRMT, and TFAM knockout, which leads to complete mtDNA depletion, impairing mitochondrial function. (B) Phase-contrast images of SK-N-BE(2) and CHP134 cells treated with DMSO, RA, NEN, RA+NEN, with or without rotenone. (C) Heatmap displaying gene expression related to RA signaling and differentiation in SK-N-BE(2) and CHP134 cells under different treatments, measured by q-RT-PCR. (D) Schematic of ρ0 cell generation through EtBr treatment. (E) Left: Confocal images showing mitochondrial morphology in WT and ρ0 cells. Right: the ratio of linear/circular mitochondria. (F) mtDNA quantification in SK-N-BE(2) and CHP134 WT and ρ0 cells. (G) Energy map of mitochondrial respiration in WT and ρ0 cells. (H) Phase-contrast images of WT and ρ0 cells treated with DMSO, RA, NEN, or RA+NEN. (I) Western blot of TFAM and β-actin in CHP134 cells with TFAM knockout. (J) mtDNA quantification and energy map for CHP134 sgCTRL and sgTFAM cells. (K) Phase-contrast images of CHP134 sgCTRL and sgTFAM cells treated with DMSO, RA, NEN, or RA+NEN.

