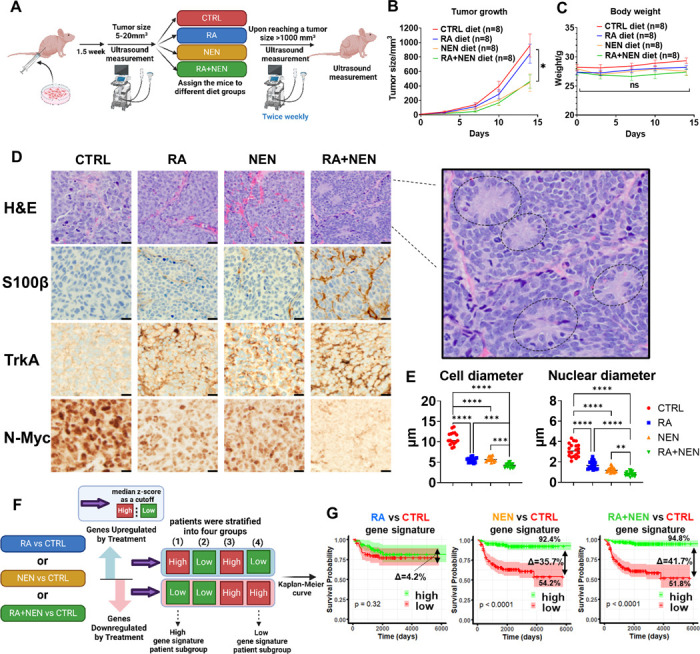
Figure 5. Effects of RA and NEN treatment on tumor differentiation in an orthotopic neuroblastoma model and potential beneficial impact on patient survival.

(A) Schematic representation of the experimental design showing ultrasound monitoring, dietary interventions (CTRL, RA, NEN, and RA+NEN), and tumor size measurements until euthanasia. (B) Tumor growth curves displaying the effects of different diets on tumor volume over time. (C) Body weight measurements of mice under various diet conditions to assess treatment tolerance. (D) Representative histological sections with H&E staining and immunohistochemistry (IHC) for S100β, TrkA, N-Myc, and NF across treatment groups. (E) Quantification of cell and nuclear diameters, as well as the mitosis-karyorrhexis index (MKI), under different treatments. (F) Schematic illustrating bioinformatic analysis to stratify patient subgroups based on gene signature upregulation and downregulation. (G) Kaplan-Meier survival curves for patients with low or high RA, NEN, and RA+NEN treatments gene signatures.
