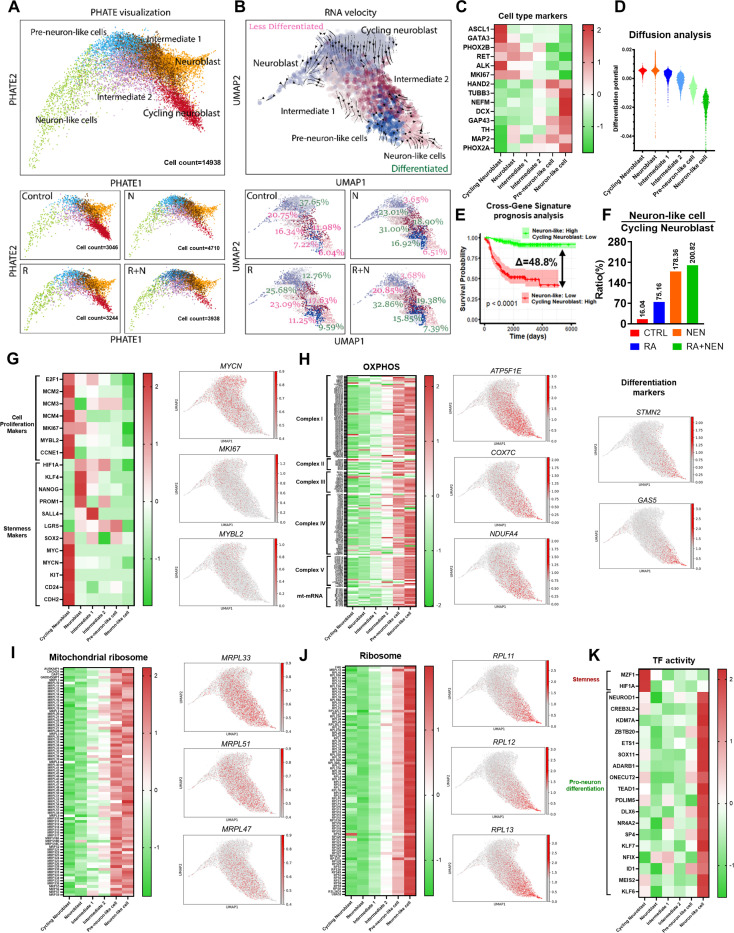
Figure 6. Single-cell RNA sequencing reveals differentiation dynamics induced by RA and uncoupler treatments.
(A) PHATE visualization showing the differentiation trajectory from Cycling Neuroblasts to Neuron-like cells, illustrating distinct cell clusters at different stages of differentiation (Cycling Neuroblast, Neuroblast, Intermediate 1, Intermediate 2, Pre-neuron-like, and Neuron-like cells). (B) RNA velocity analysis highlights the directional differentiation process, with cells transitioning from less differentiated (Cycling Neuroblast) to more differentiated (Neuron-like cells). (C) Heatmap of differentiation stage markers indicating the expression patterns of key genes across different cell clusters. Cycling neuroblast markers include ASCL1, GATA3, PHOX2B, RET, ALK, and MKI67, while neuron markers include HAND2, TUBB3, NEFM, DCX, GAP43, TH, MAP2, and PHOX2A.(D) Diffusion analysis shows the transition probabilities across the cell populations, emphasizing the differentiation from Cycling Neuroblasts to Neuron-like cells. (E) Cross-gene signature prognosis analysis shows a significant improvement in survival probability associated with higher Neuron-like/Cycling Neuroblast ratios, highlighting the therapeutic relevance of promoting differentiation. (F) Bar graph comparing the ratio of Neuron-like cells to Cycling Neuroblasts across treatment conditions. (G) Heatmap of cell proliferation markers and stemness markers across cell clusters and treatments. (H-K) Heatmaps depicting the expression patterns of genes related to OXPHOS, mitochondrial ribosome, ribosome, and transcription factor activity, respectively, along the differentiation trajectory.

