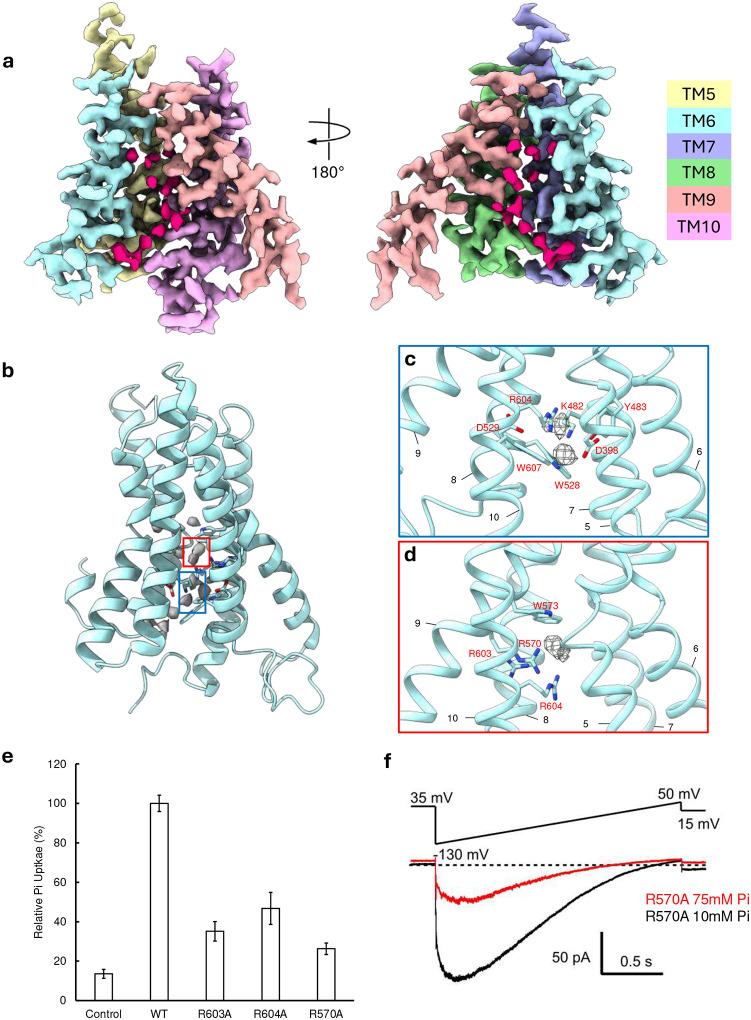
Fig. 4: Putative ion coordination sites.
a. The density map of TM5–10 of Pi/InsP6-hXPR1, with each TM helix colored individually at a contour level of 10.96σ. The non-protein isolated densities within the pore are colored in pink red. Densities from TM5 and TM10 (right), or TM7 and TM8 (left) are removed to expose the pore. b. The string of putative ion densities in grey depicted at 10.96σ contour level with the cartoon representation of Pi/InsP6-hXPR1 TM5–10 structure. Densities corresponding to the two putative ion coordination sites are box in red and blue. c.d. Close-up views of the two putative ion coordination sites indicated in the colored boxes in b, with the ion density shown at 5.35σ contour level. e. Relative Pi transport of the alanine mutations of three arginine residues within the red-colored putative Pi binding in c. The relative transport was measured at the 20-minute time point with membrane valinomycin. (n=4). f. XPR1 R570A currents evoked from a GUV patch by voltage ramps are decreased as internal Pi is increased from 10 mM (black) to 75 mM (red), using 10 Cl K-MSA internal solutions with external 1 Pi, 10 NMDG-Cl.

