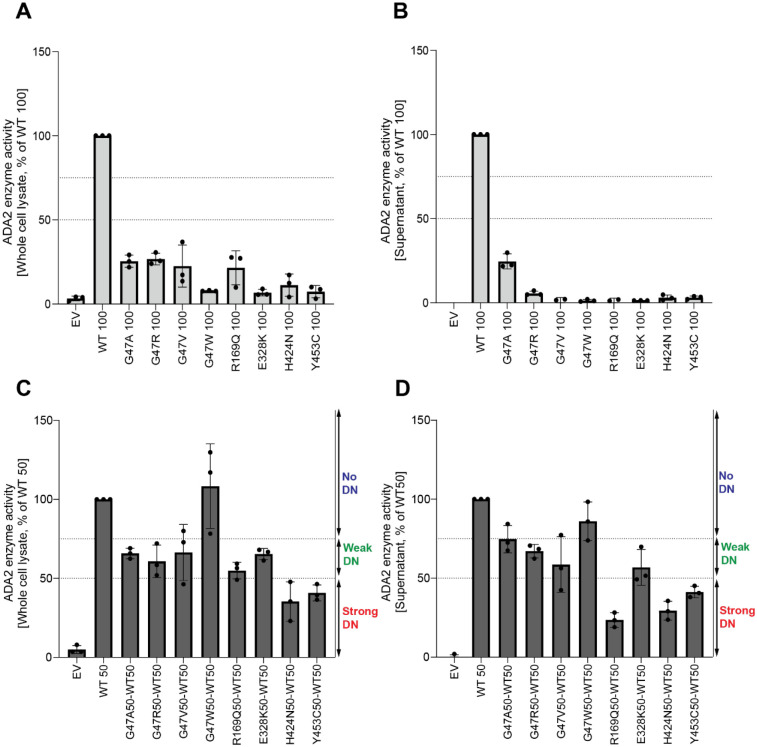
Figure 3. Adenosine deaminase activity of ADA2 variants in homozygous or heterozygous state.
A. Adenosine deaminase activity in whole cell lysate of HEK293T transfected cells with WT and ADA2 variants in homozygous conditions. Bar graphs represent the percentage of enzymatic activity relative to wild-type ADA2 100%. B. Adenosine deaminase activity in supernatant of HEK293T transfected cells with WT and ADA2 variants in homozygous conditions. Bar graphs represent the percentage of enzymatic activity relative to wild-type ADA2 100%. C. Adenosine deaminase activity whole cell lysate of HEK293T transfected cells with WT and/or ADA2 variants in heterozygous conditions. Bar graphs represent the percentage of enzymatic activity relative to wild-type ADA2 50%.. D. Adenosine deaminase activity in supernatant of HEK293T transfected cells with WT and/or ADA2 variants. Bar graphs represent the percentage of enzymatic activity relative to wild-type ADA2 50%.. A-D. Data represents mean ± SD from 3 independent experiments.

