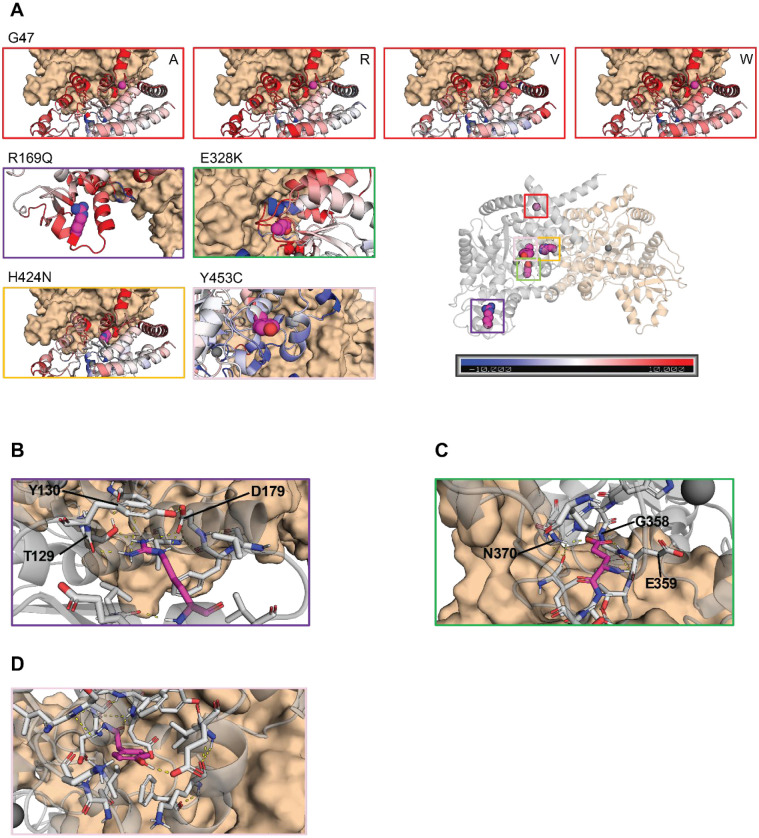
Figure 4. Molecular modeling of ADA2 variants G47A, G47R, G47V, G47W, R169Q, E328K, H424N and Y453C.
A. Comparative plots of the different mutations which displays the variability of B-factor values along the protein backbone compared to the wild target. Blue backbones represent lower fluctuations compared to the wild target, red backbones represent higher fluctuations. B. Zoom-in of residue R169 in the wild target protein. R169 is shown in magenta. Polar and aromatic interactions are shown as dashed lines. C. Zoom-in of residue E328 in the wild target protein. E328 is shown in magenta. Polar interactions are shown as dashed lines. D. Zoom-in of residue Y453 in the wild target protein. Y453 is shown in magenta. Polar interactions are shown as dashed lines.

