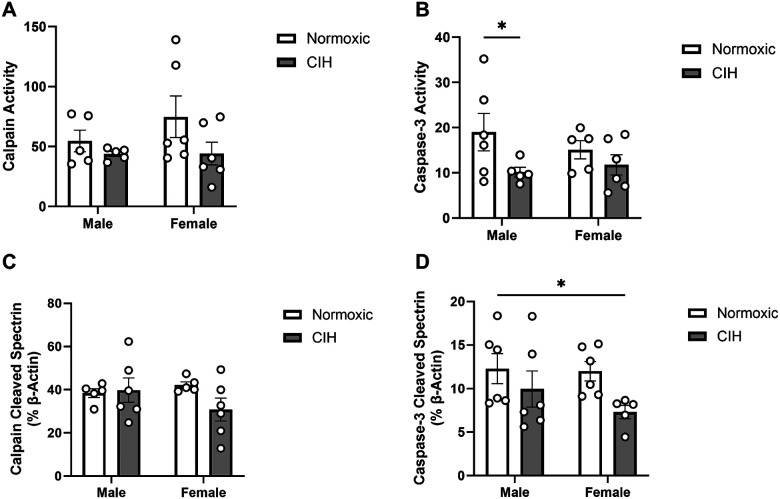
Figure 4. Protease activity and cleavage products in the raphe nucleus.
(A) Quantified calpain activity, (B) quantified caspase-3 activity, (C) expression of calpain cleaved spectrin, and (D) expression of caspase-3 cleaved spectrin in the RN. Calpain and caspase-3 activity represent % of protease cleaved spectrin to uncleaved spectrin (250 kD). Calpain cleaved spectrin (150 kD) and caspase-3 cleaved spectrin (120 kD) expression normalized to β-actin. Raw values are shown and error bars denote mean ± S.E.M. Analyzed by 2-way ANOVA with Fisher’s LSD multiple comparisons tests. Post-hoc significance indicated by: * = p≤0.05; ** = p≤0.01. Significant effects observed: (B): CIH (F1, 18=4.758; p=0.043; η2=0.199); (D): CIH (F1, 19=5.036; p=0.037; η2=0.198). CIH: Chronic intermittent hypoxia; RN: Raphe nucleus.

