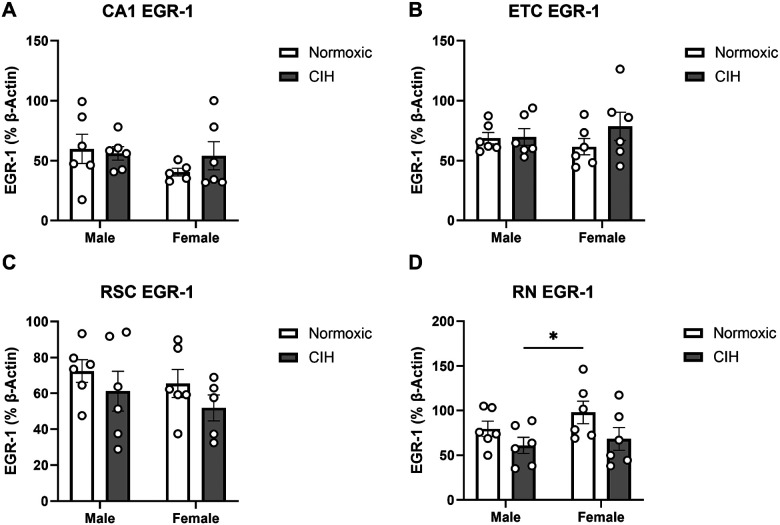
Figure 5. EGR-1 expression in the hippocampus and associated brain regions.

(A) Quantified EGR-1 expression in the CA1; (B) ETC; (C) RSC; and (D) RN. EGR-1 expression normalized to β-actin. Raw values are shown and error bars denote mean ± S.E.M. Analyzed by 2-way ANOVA with Fisher’s LSD multiple comparisons tests. Post-hoc significance indicated by: * = p≤0.05. Significant effect observed (D): CIH: (F1, 20=4.857; p=0.039; η2=0.183). CIH: Chronic intermittent hypoxia; ETC: Entorhinal cortex; RN: Raphe nucleus; RSC: Retrosplenial cortex.
