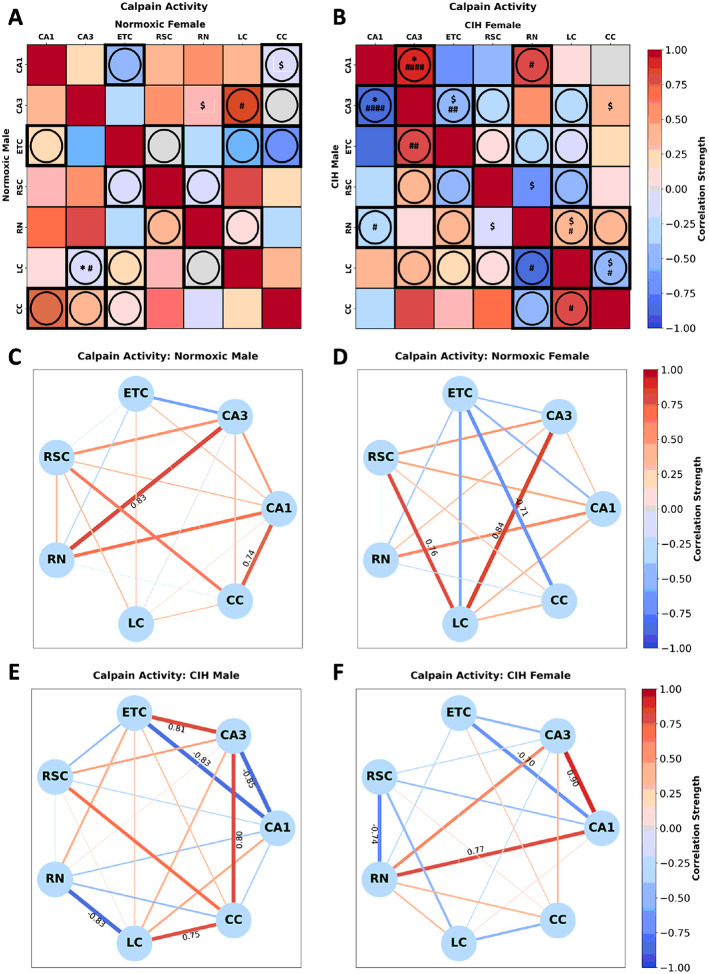
Figure 6. Sex and CIH differences in the inter-regional correlations of calpain activity.

(A) Heatmaps of calpain activity in normoxic and (B) and CIH males and females. (C) Correlation connectomes for normoxic males, (D)normoxic females, (E) CIH males, and (F) CIH females. Darkness of color (A-F) and thickness of network edges (C-F) represent the strength of the correlation, with correlations larger than ± 0.67 labeled. Correlations between brain regions were analyzed by Pearson correlations. Significance indicated by: $ = p≤0.10; * = p≤0.05. Correlations that are in opposite directions are indicated with a circle and green outline. Significance between sexes was determine using z-test statistics. Significance indicated by # = p≤0.10; ## = p≤0.05; #### = p≤0.001.
