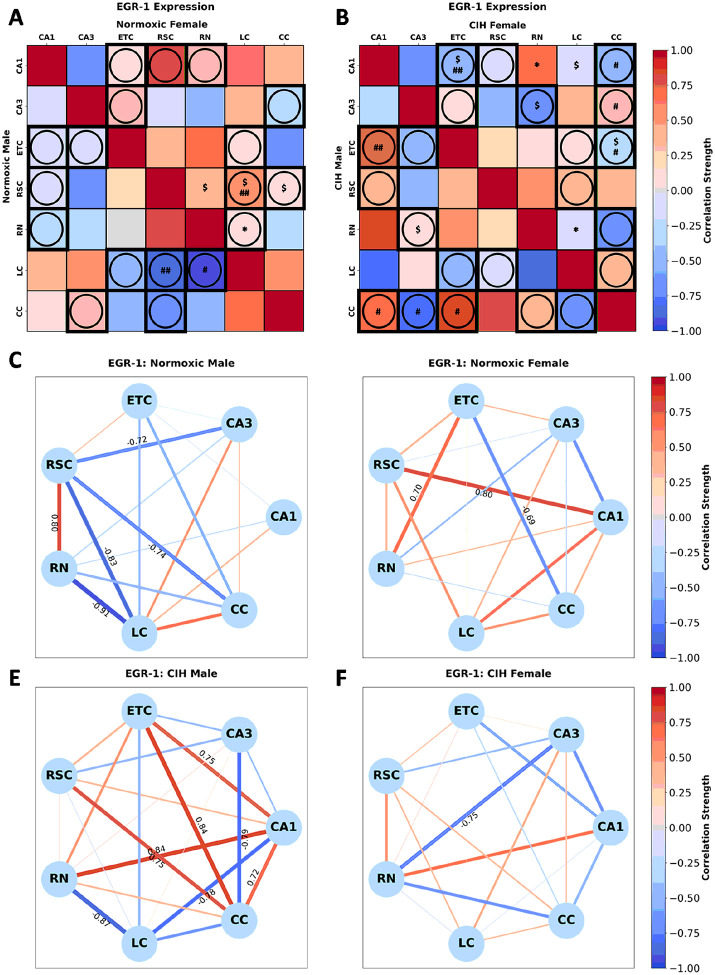
Figure 8. Sex and CIH differences in the inter-regional correlations of EGR-1 expression.
(A) Heatmaps of EGR-1 expression in normoxic and (B) and CIH males and females. (C) Correlation connectomes for normoxic males, (D)normoxic females, (E) CIH males, and (F) CIH females. Darkness of color (A-F) and thickness of network edges (C-F) represent the strength of the correlation, with correlations larger than ± 0.67 labeled. Correlations between brain regions were analyzed by Pearson correlations. Significance indicated by: $ = p≤0.10; * = p≤0.05. Correlations that are in opposite directions are indicated with a circle and green outline. Significance between sexes was determine using z-test statistics. Significance indicated by # = p≤0.10; ## = p≤0.05.

