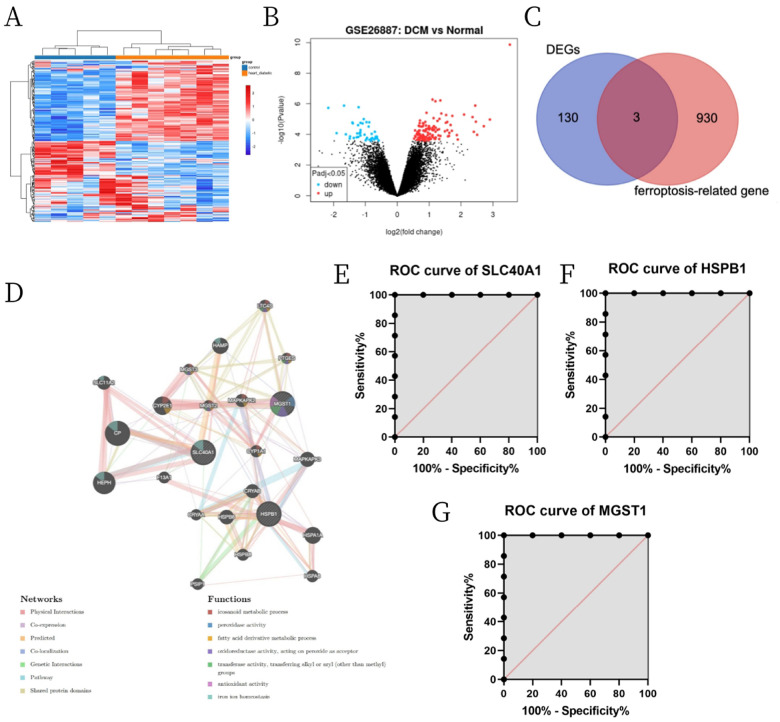
Figure 1.
Identification of DE-FRGs and their role in DCM. (A) Volcano plot of DEGs. (B) Heatmaps of DEGs. (C) Venn diagram of DE-FRGs from GSE26887 and FerrDb. (D) PPI network of genes associated with three DE-FRGs. (E, F) ROC curve analysis revealing the diagnostic values of the three DE-FRGs in DCM.

