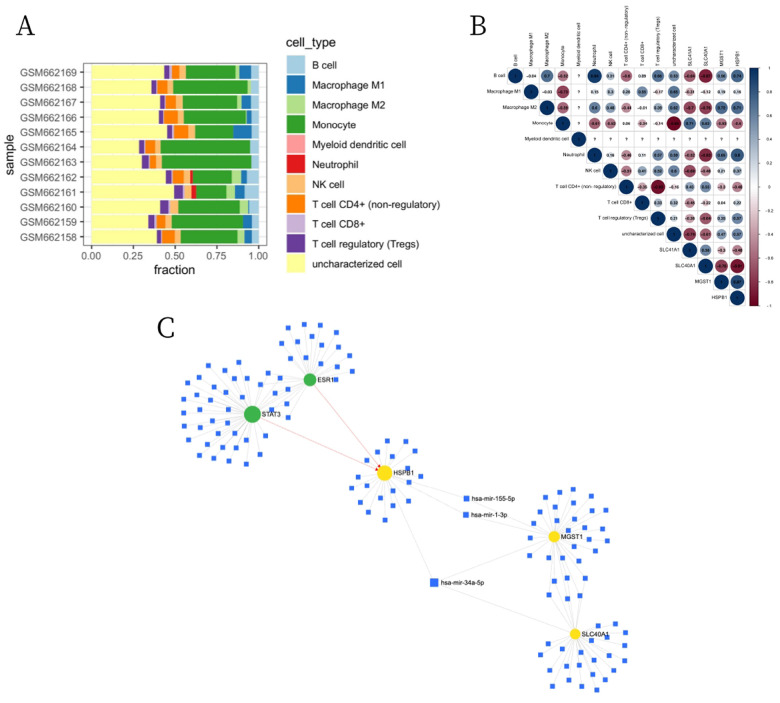
Figure 2.
Immune infiltration analysis and miRNA regulatory network of DE-FRGs. (A) The enrichment fraction of 11 types of immune infiltrating cells in the DCM and normal samples. (B) Correlation heat map between 11 types of immune cells and DE-FRGs (blue indicates a positive correlation, red indicates a negative correlation, and the depth of the color indicates the degree of correlation). (C) Construction of the TF-miRNA-DE-FRGs network based on miRNet (blue indicates miRNA, green indicates TF, and yellow indicates DE-FRGs).

