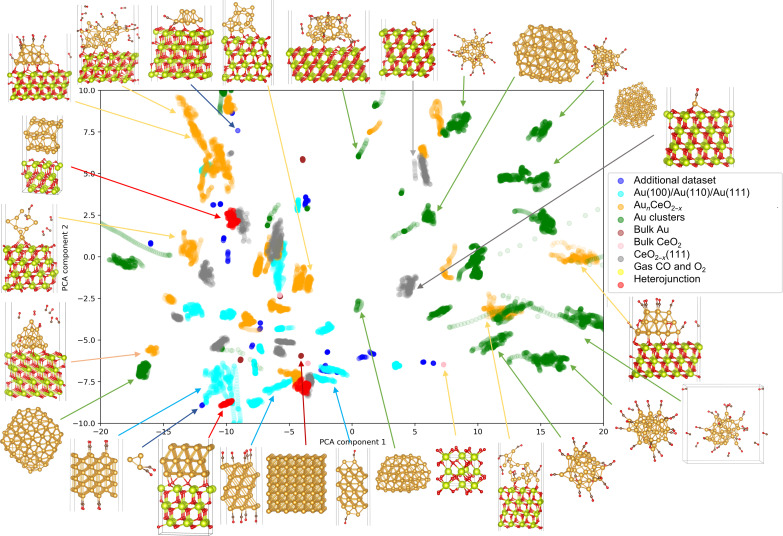
Fig. 1. PCA-based similarity map of the training set for the local environment embedding networks consisting of 34,158 structures.
The structures are colored according to their types from the initial dataset. The plot visualizes the distribution and clustering of different local environments in the high-dimensional space, reduced to two dimensions using PCA. Examples of atomic configurations from various regions of the map are provided to illustrate the dataset’s diversity. The color code for elements is as follows: Au, yellow; Ce, green; O, red; C, gray.

