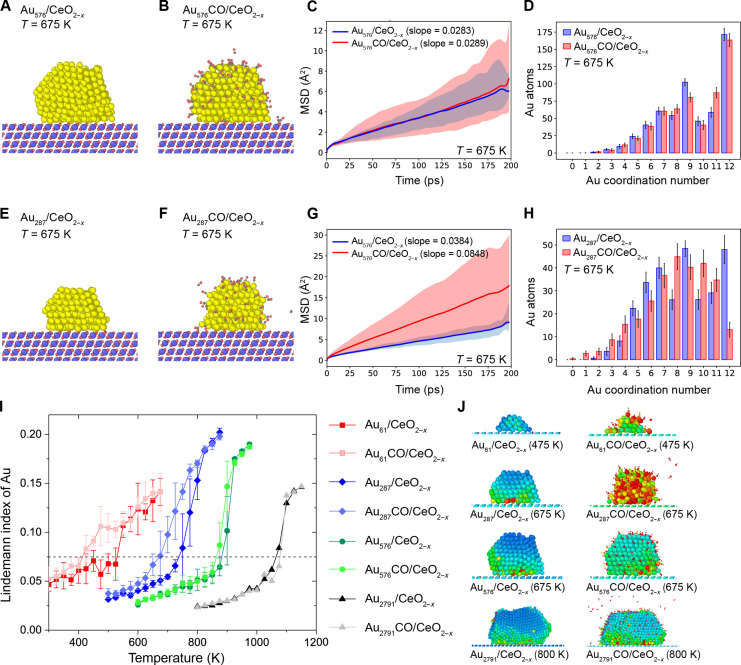
Fig. 2. DPMD simulations of supported Au61, Au287, Au576, and Au2791 NPs on defected CeO2(111).
Snapshot pictures at 200 ps for (A and B) Au576/CeO2−x(111) without and with a CO atmosphere and (E and F) Au287/CeO2−x without and with a CO atmosphere at a temperature of 675 K during DPMD simulations. The color code for elements is as follows: Au, yellow; Ce, blue; O, red; C, gray. (C and G) Corresponding MSDs averaged over five DPMD simulation trajectories. (D and H) Coordination number distribution of Au atoms without and with CO adsorption with a Au─Au bond cutoff criterion of 3.4 Å. (I) Lindemann index versus temperature during DPMD simulations for Au61/CeO2−x(111), Au287/CeO2−x(111), Au576/CeO2−x(111), and Au2791/CeO2−x(111) without and with a CO atmosphere. (J) Colored local Lindemann index snapshots at 200 ps, where the big balls are Au and Ce atoms, and the small balls represent C and O atoms. Blue balls denote that the Au atoms keep their fcc crystal structure, and red balls denote that Au atoms are disordered.

