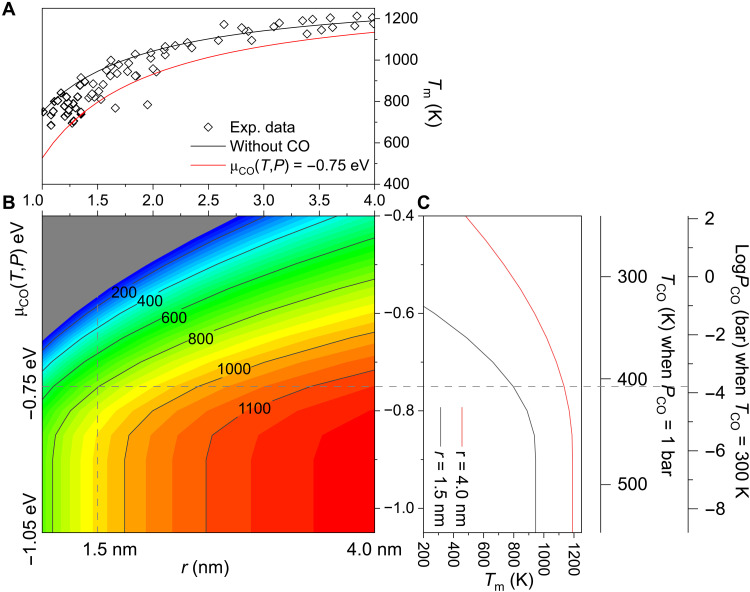
Fig. 3. Melting point (Tm) of Au NPs with different sizes.
(A) Size dependence of the melting point. The black line represents Tm from Gibbs-Thomson equations without CO adsorption, and the red line is plotted with CO adsorption at μCO(T, P) = −0.75 eV. Diamonds are experimental data from Buffat and Borel (29) of Au NPs on carbon films. (B) Contour plot of Tm versus chemical potential [μCO(T, P)] and radius of NPs (r). (C) Tm of Au NPs versus μCO(T, P) with radii of 4.0 nm (red line) and 1.5 nm (black line). The relations between μCO(T, P) and T at PCO = 1 bar and PCO at T = 300 K are indicated on the ordinate.

