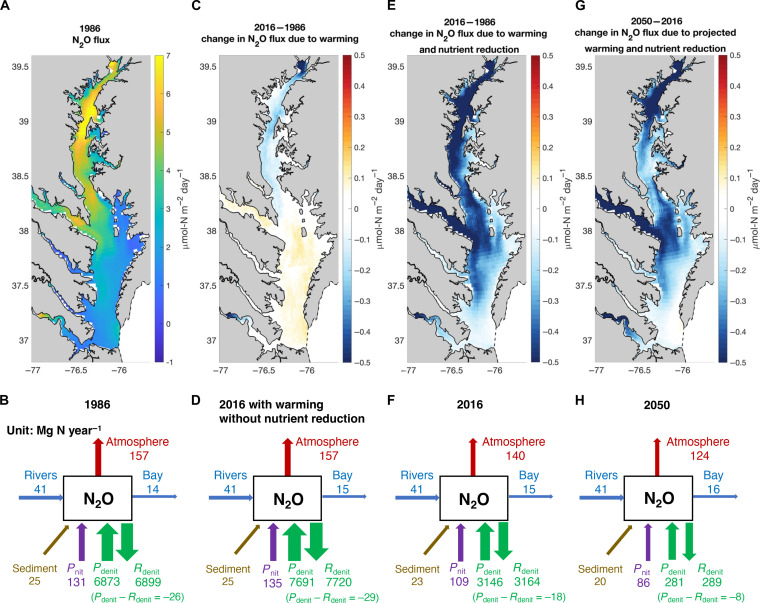
Fig. 6. Model-predicted N2O emissions in the Chesapeake Bay under warming and changes in nutrient loading.
(A) Map of N2O emission into the atmosphere and (B) budget of N2O cycling (unit: Mg N year−1) in 1986. (C) Changes in N2O emission and (D) budget of N2O cycling in 2016 due to historical warming and atmospheric N2O increase and without nutrient reduction. (E) Changes in N2O emission and (F) budget of N2O cycling in 2016 under historical warming, atmospheric N2O increase, and nutrient reduction. (G) Changes in N2O emission and (H) budget of N2O cycling in 2050 under future projected warming, atmospheric N2O increase from RCP8.5 emission scenario, and meeting the mandated the Chesapeake Bay TMDL nutrient reduction goal (28).

