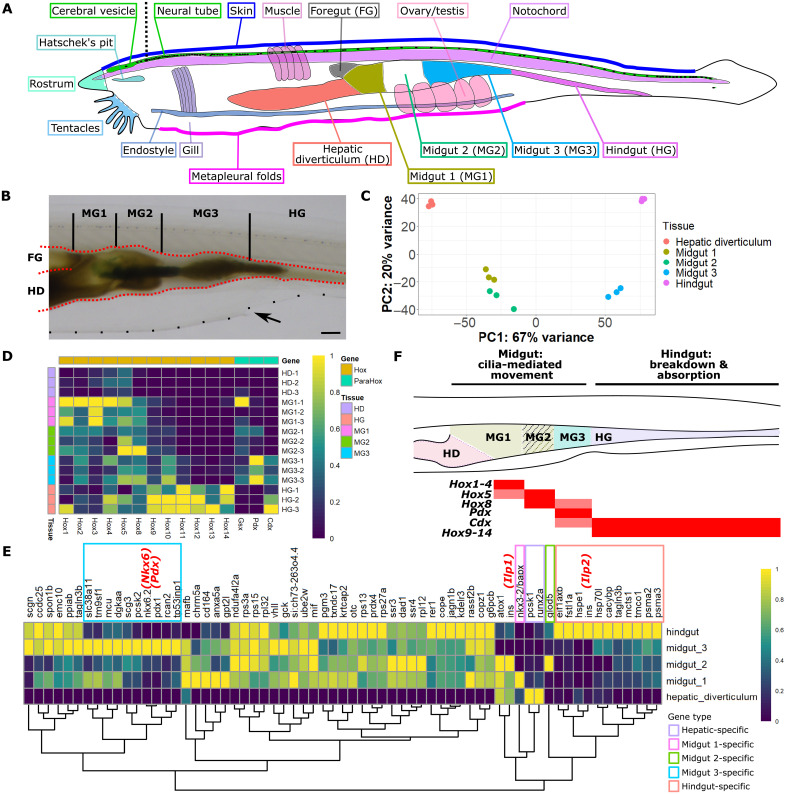
Fig. 1. Transcriptomic profile of the amphioxus gut.
(A) Adult amphioxus with the location and name of dissected tissues indicated using different colors. A black dotted line indicates the approximate location of the incision made to separate the “cerebral vesicle” and “neural tube.” “Foregut (FG)” is labeled to indicate the location of this section, which was removed during sampling. (B) Gut tissue is highlighted in red, whereas the metapleural folds at the ventral side of body are indicated by a dotted black line. A black arrow indicates the atriopore. Scale bar, 1 mm. (C) PCA plot showing the distribution of all 15 digestive tissue samples. Each type of tissue has three biological repeats obtained from two amphioxus individuals. Normalized expression of (D) amphioxus Hox and ParaHox genes and (E) amphioxus orthologs to zebrafish pancreatic β cell–specific genes. Genes with less than five TPM expression in the five digestive tissues are omitted. All gene IDs are in table S1. In (E), gene names shown are their zebrafish orthologs, with amphioxus Ilp1 and Ilp2 genes highlighted in red, and genes enriched in different gut sections marked in different colored boxes. (F) Summary of gut section profiles in adult amphioxus. Expression pattern of all Hox genes included in (D), and two ParaHox genes, Pdx and Cdx, are indicated below a simplified depiction of the amphioxus gut. Each of the five gut sections are shown in a different color, with the shaded region indicating the section of the gut that is deeper in appearance to the naked eye. Midgut and hindgut function, as predicted by transcriptomic analysis, is indicated above this simplified diagram. HD, hepatic diverticulum; FG, foregut; MG, midgut; HG, hindgut.

