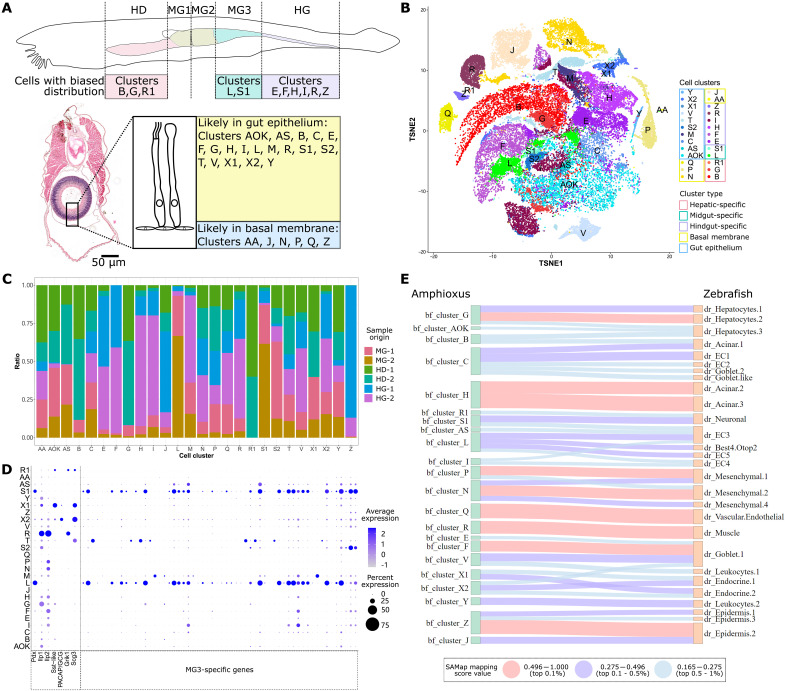
Fig. 2. Single-cell profiling of wild-type amphioxus digestive tissue.
(A) Predicted location of amphioxus cells digestive tissue. Different regions along the gut A-P axis are shown in different colors, with clusters enriched in these regions listed below. A cross section sampled in the MG3 region of a juvenile individual is shown with a cartoon indication of gut epithelia and cells making up the gut basal membrane. Cluster IDs of cell predicted to be located in the gut epithelia and basal membrane are listed. Scale bar, 50 μm. (B) TSNE plot of adult amphioxus cell types from the hepatic diverticulum, midgut, and hindgut tissue. Clusters predicted in (A) to be enriched in different gut locations are marked in different colored boxes. (C) Summary of cell cluster identity and their sample of origin. (D) Dot plot of marker genes used to characterize cell clusters L, S1, S2, R, X1, and X2. Gene ID for each amphioxus gene is shown below, with gene names provided for genes discussed in the main text. (E) Sankey plot for amphioxus gut cell clusters and zebrafish gut cell types. Cell types in the two species with strong similarity (ranking top 1%) are connected by a red line, those with medium similarity (ranking 1 to 5%) are connected by a purple line, and those showing weak similarity (ranking 5 to 10%) are connected by a blue line. Predicted similarities with arbitrary mapping scores not in the top 10% tier are not shown. HD, hepatic diverticulum; MG, midgut; HG, hindgut.

