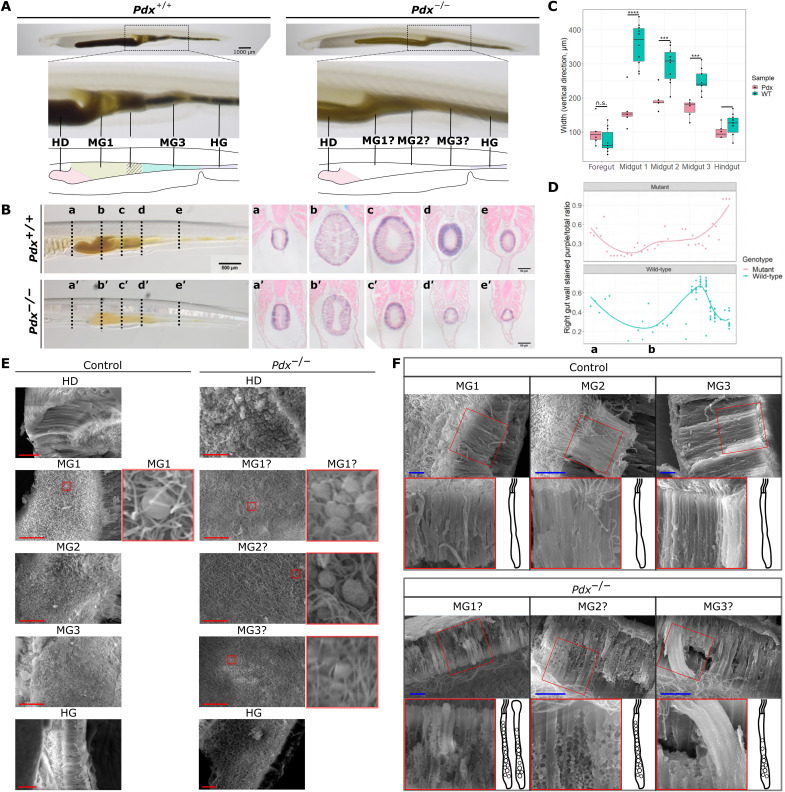
Fig. 3. Pdx mutant amphioxus.
(A) Representative control and Pdx mutant juveniles. Magnification of the midgut region shows lack of midgut patterning in mutants, summarized by a simplified cartoon below. Scale bar, 1 mm. (B) H&E-stained sections of control and Pdx mutants. The approximate locations where sections were sampled from are indicated using lowercase letters. Scale bar, 500 μm for fixed individuals. Scale bars, 50 μm for stained sections. (C) Foregut, midgut, and hindgut width in control and Pdx mutants. Each dot represents one slide section sampled from one individual. Statistical analysis was performed using two-sided t tests; n.s., no significance, ***P = between 0.001 and 0.0001, ****P = below 0.0001. (D) Ratio of tissue in the gut wall that is stained purple in control and Pdx mutant samples. (E) Digestive tissue under a scanning electron microscope. One representative photo from the HD, MG1, MG2, MG3, and HG regions was selected for the control and Pdx mutant groups. Midgut regions with rounded cells are highlighted in red, and these regions are magnified and shown on the right side of the original photograph. Scale bars, 20 μm. (F) Scan of MG1, MG2, and MG3 gut cross sections in control and Pdx mutant samples. One region indicated using a red box is magnified and rotated to depict the gut cell with its apical end pointing upward. A cartoon of a representative gut cell in each photo is provided to assist interpretation. Scale bars, 20 μm. All enlarged regions are magnified by a scale of 2. HD, hepatic diverticulum; MG, midgut; HG, hindgut.

