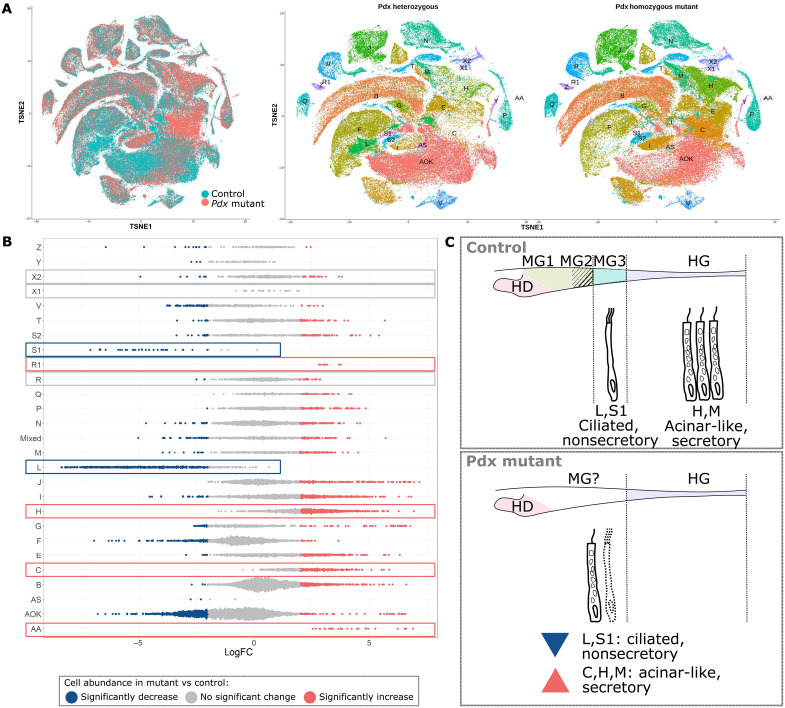
Fig. 4. Single-cell profiling of Pdx mutant amphioxus digestive tissue.
(A) TSNE plot of control and Pdx mutant gut cells. Cells are colored by genotype in the left panel and by cell cluster in the right panel. (B) Difference in cell abundance between control and Pdx mutant. miloR assigns cells into neighborhoods that may not necessarily belong to the same manually defined cluster (46). Hence, the y axis includes an additional category named “Mixed” that correspond to all miloR-defined neighborhoods that have less than 50% of cells assigned to the same manually defined cluster. Dots in red are neighborhoods that are significantly increased in cell abundance in Pdx mutants, and those in blue are significantly decreased. Neighborhoods in gray do not have significant difference in abundance. (C) Pdx mutants lack ciliated, nonsecretory clusters L and S1 cells in the MG3 region of their midgut, whereas acinar-like secretory clusters C, H, and M cells show a significant increase in abundance. HD, hepatic diverticulum; MG, midgut; HG, hindgut.

