FIGURE 2.

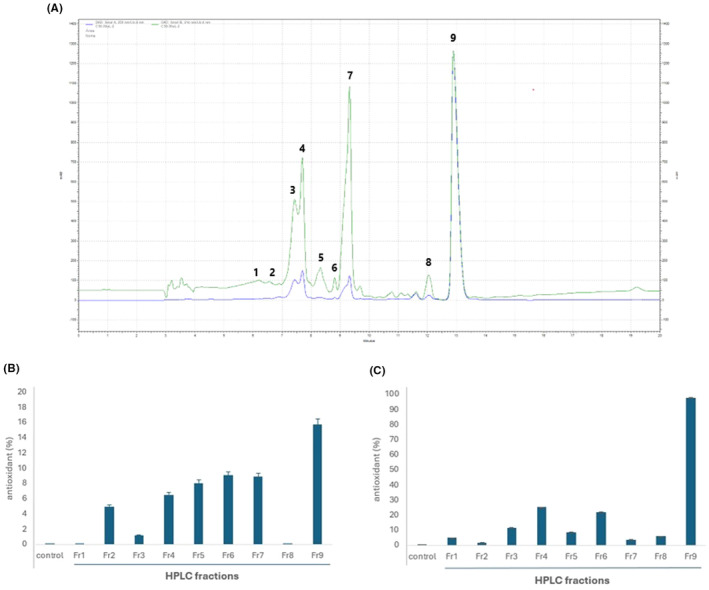
(A) Chromatographic profile of fraction 20%, obtained by SPE, from Tubastraea tagusensis methanolic extract. Numbers indicate the peaks collected. The green line is the chromatogram obtained with λ = 214 nm and the blue line 254 nm. (B) DPPH antioxidant assay of 9 fractions from Tubastraea tagusensis (1 mg.mL−1 ); (C) FRAP antioxidant assay of 9 fractions from Tubastraea tagusensis (1 mg.mL−1).
