FIGURE 3.

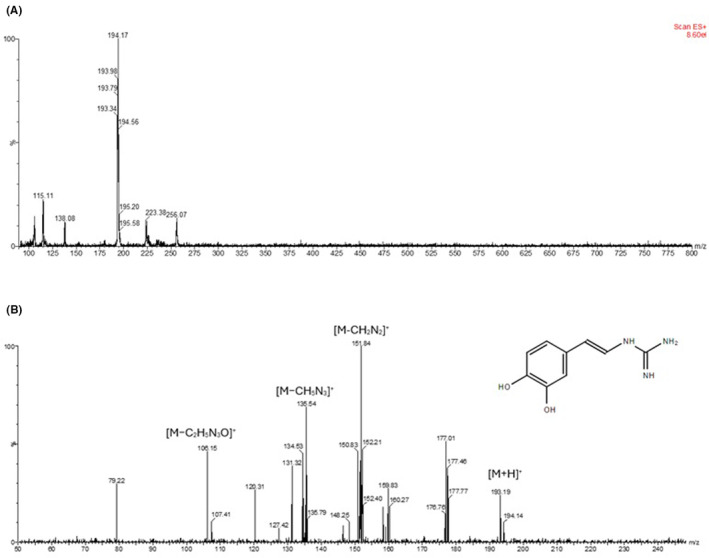
Characterization of tubastrine by mass spectrometry: (A) MS profile of the Fr9 obtained by HPLC; (B) Fragmentation of the ion 194 m/z and MS/MS profile, showing loss of groups, corresponding to tubastrine structure, insert in the figure.

Characterization of tubastrine by mass spectrometry: (A) MS profile of the Fr9 obtained by HPLC; (B) Fragmentation of the ion 194 m/z and MS/MS profile, showing loss of groups, corresponding to tubastrine structure, insert in the figure.