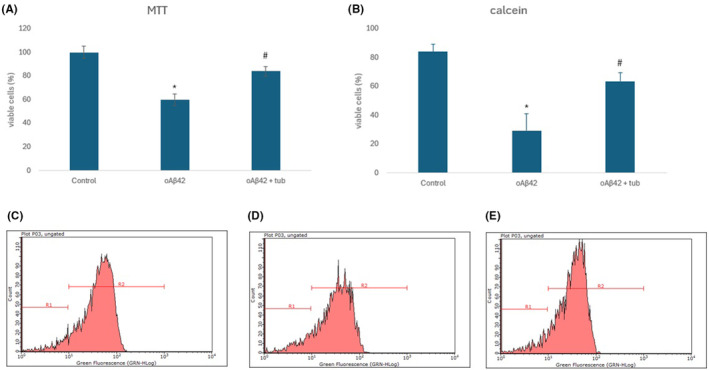
FIGURE 4.

Cell viability evaluation after neuron‐like cells treatment with oAβ42 (5 μM) or oAβ42 (5 μM) followed by tubastrine (100 μM), evaluated by: (A) MTT assay; (B) Viable cells (%) with calcein labeling; (C–E) Flow cytometry histogram of cells analysed with calcein staining and population of cells indicated as R1 or R2 for control, oAβ42 and Aβ42 + tubastrine, respectively. *p < 0.001 between control and oAβ42 and #p < 0.001 between oAβ42 and oAβ42 + tubastrine.
