eFigure.
Brain morphological image quality examination
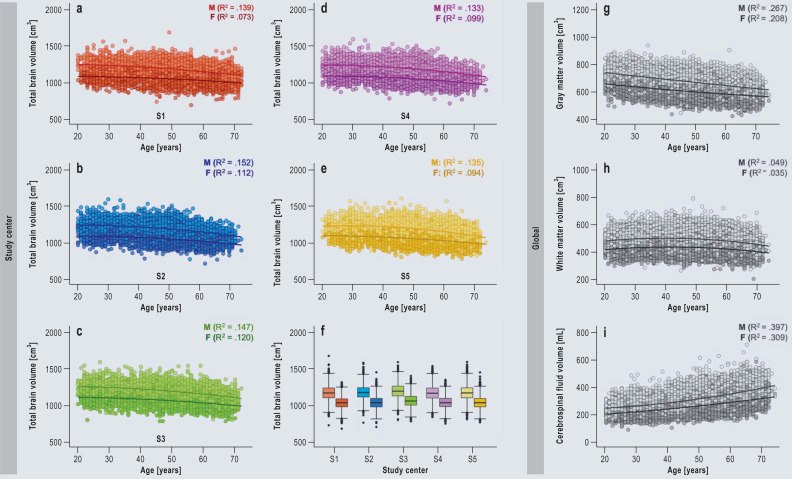
a–f) Age-related differences in total brain volume per MRI study center (Augsburg = S1 = red [n = 6074], Berlin = S2 = blue [n = 5708], Essen = S3 = green [n = 5743], Mannheim = S4 = pink [n = 5609], Neubrandenburg = S5 = yellow [n = 6664]); lighter colors = men, darker colors = women. f) Box plots showing the average total brain volume for the two sexes separately (lighter colors = men [n = 16 647], darker colors = women [n = 13 151]).
g–i) Age-related differences in gray matter volume, white matter volume, and cerebrospinal fluid volume for the two sexes separately (light gray = men, dark gray = women).

