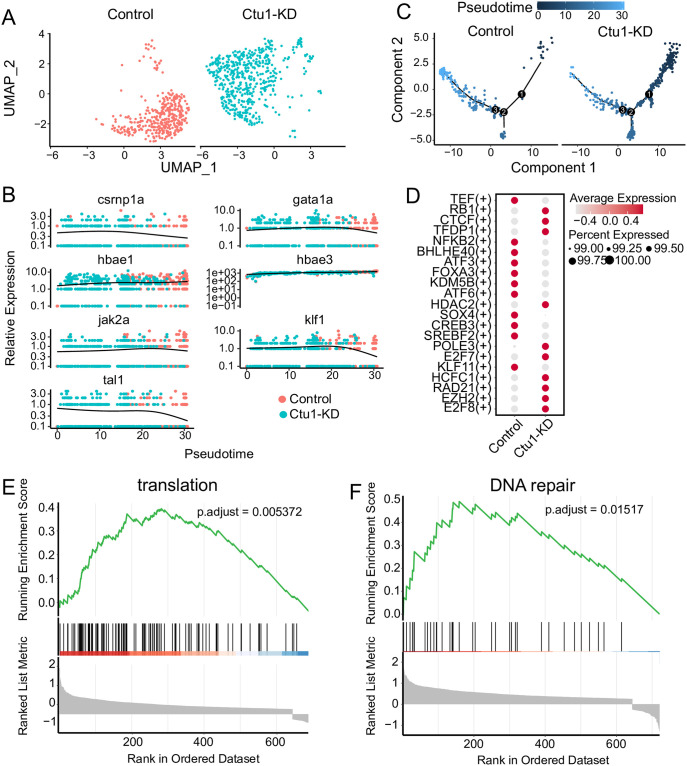
Fig 5. ctu1 deficiency suppresses erythrocyte differentiation.
(A) UMAP visualization of erythroid cells, colored according to samples. (B) The relative expression of the marker genes associated with erythroid differentiation in the pseudotime trajectories of control and ctu1 morphant. (C) Pseudotime trajectories of erythroid cells. (D) Dot plots show changes in the expression of transcription factors across different samples. The color and size of circles indicate the average expression level and percentage of cells. GSEA analysis of control and ctu1 morphant. Gene sets shown are translation (E), and DNA repair (F).

