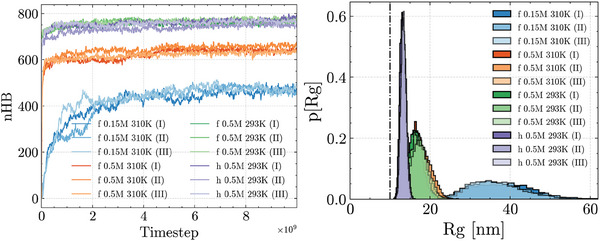
Figure 4.

(Left) Evolution of the total amount of hydrogen‐bonding interactions (nHB) and of (Right) the gyration radii of the RNA2 molecules, from the freely‐folding MD at 0.15 and 0.5 M (all scenarios): Higher (effective) salt concentrations and lower temperatures account for an increase in the nucleotide pairings, while fixing a harmonic restraint between the RNA termini yields a further decrease in the gyration radii of RNA2 (“h” curves). We note that all MD replicas per salt concentration converge to a consistent (nHB, R g ) plateau, regardless of the starting structure. The dot‐dashed line marks the estimate value of the gyration radius of RNA2 reported in ref. [49]. The labels “f” and “h” refer to the disjointed (free) and restrained (harmonic) RNA termini scenarios respectively.
