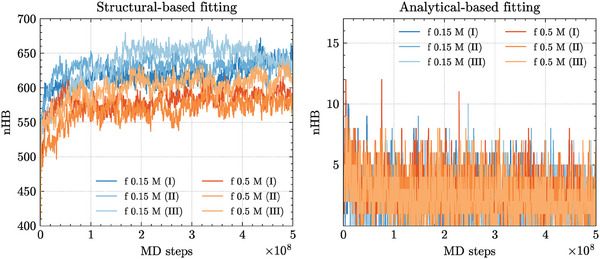
Figure 7.

The total amount of hydrogen‐bonding interactions (nHB) from the MD trajectories of RNA2 at 310 K within a capsid‐like electrostatic environment, obtained by applying either (left) a structure‐based (U cap (r)) or (right) an analytical approach (U yuk (r)) (details in the text).
