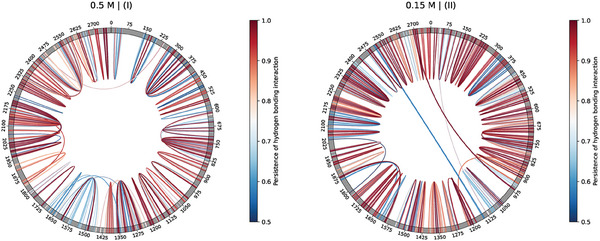
Figure 8.

Chord diagram depiction of the stable hydrogen‐bonding contacts, i.e., conserved in over 50% of the trajectory frames, corresponding to (left) replica I at 0.5 M (310 K), and (right) replica II at 0.15 M (310 K), within the U cap (r) capsid‐like, electrostatic environment (details in the main text).
