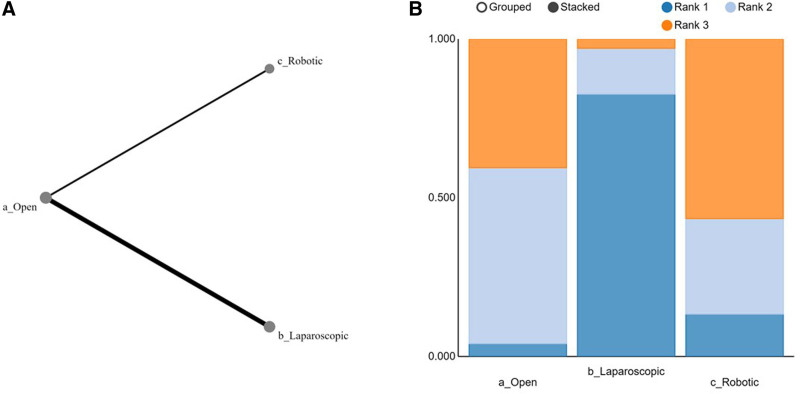
FIGURE 4.
Network graph and Rankogram comparing LOS. A, Rankogram showing relative effectiveness of each intervention. B, Network graph showing direct comparisons. Line thickness corresponded with the number of studies assessing a particular direct comparison and the size of nodes correlated with the number of participants receiving a particular intervention.

