. 2024 Dec 20;13:RP100173. doi: 10.7554/eLife.100173

Figure 5. The observation of lineage tracing of PDGFR-α+ and NFATc1+ cells in M1 by whole-mount and high-speed imaging.

(A) The flowchart of tracing. The mice were administrated with tamoxifen at D1 and D3, and sacrificed at D11. (B) The 3D images of contoured M1 of maxilla, including pulp and PDL with virtual dentin shell (white) in buccal view (scale bar = 300 μm). (D) Image stack was displayed in buccal view, coronal view, and radicular view of pulp and PDL, respectively. (E) An optical slice was acquired on the X-Z (scale bar = 400 μm) and X-Y direction to display the pulp and PDL (scale bar = 300 μm).

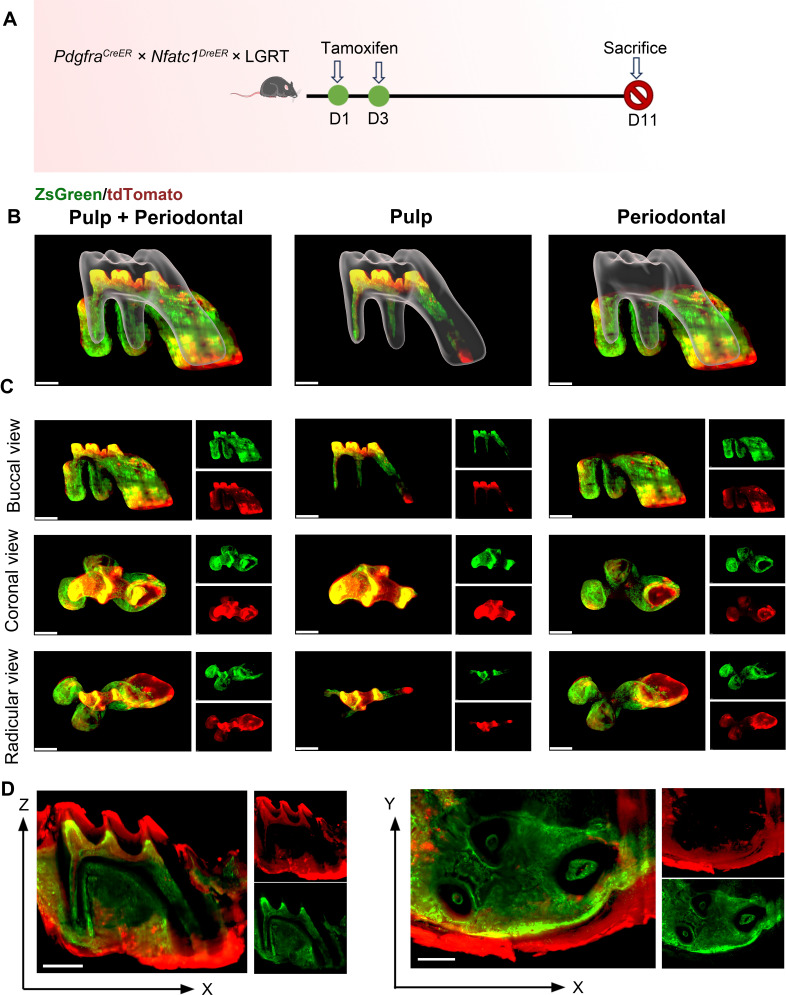
Figure 5.

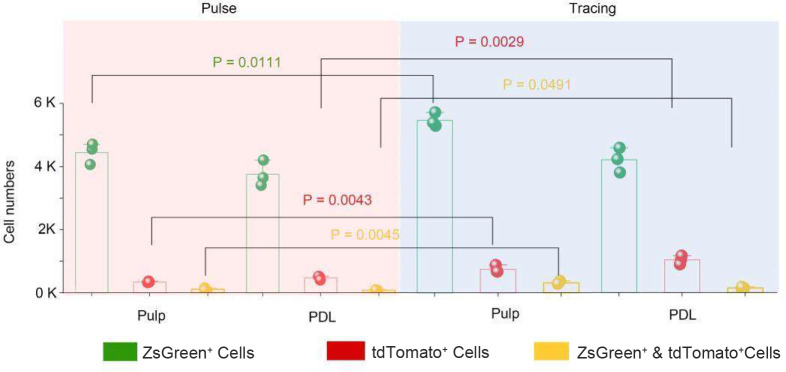
Figure 5—figure supplement 1. The number of PDGFR-α+ cells, NFATc1+ cells, and PDGFR-α+&NFATc1+ cells in pulp and PDL, respectively.

Figure 5—figure supplement 1.

The quantification was done on a z stack of images in Imaris using the automatic spot detection feature.
Figure 5—figure supplement 1—source data 1. The tables present the source data for the number of PDGFR-α+ cells, NFATc1+ cells, and PDGFR-α+&NFATc1+ cells in pulp and PDL, respectively.
The quantification was done on a z stack of images in Imaris using the automatic spot detection feature.
Figure 5—video 1. Panoptic multicolor imaging of ZsGreen+ cells (green) & tdTomato+ cells (red) in the pulp and PDL area of maxilla M1 of PdgfraCreER×Nfatc1DreER× LGRT mice (tracing 11 days), the whole-tissue imaging was achieved through TC procedure, related to Figure 5B.
Download video file (1.5MB, mp4)