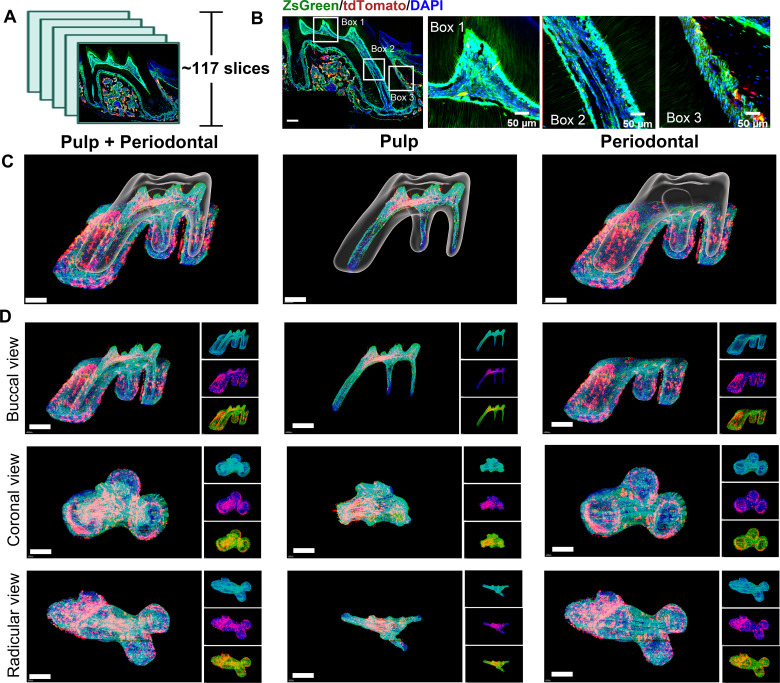
Figure 6. Using traditional serial section for imaging of maxilla of PdgfraCreER×Nfatc1DreER× LGRT mice (tracing 11 days).
(A) Using this procedure, a total of 117 slices were collected in this sample. (B) Representative images acquired by confocal microscopy (scale bar = 200 μm). Box 1: coronal pulp; Box 2: root pulp; Box 3: PDL (scale bar = 50 μm). (C) Maxilla M1 after 3D reconstruction by imaris, including pulp and PDL with virtual dentin shell (white) in buccal view (scale bar = 300 μm). (D) Image stack was displayed in buccal view, coronal view, and radicular view of pulp and PDL, respectively (scale bar = 300 μm).
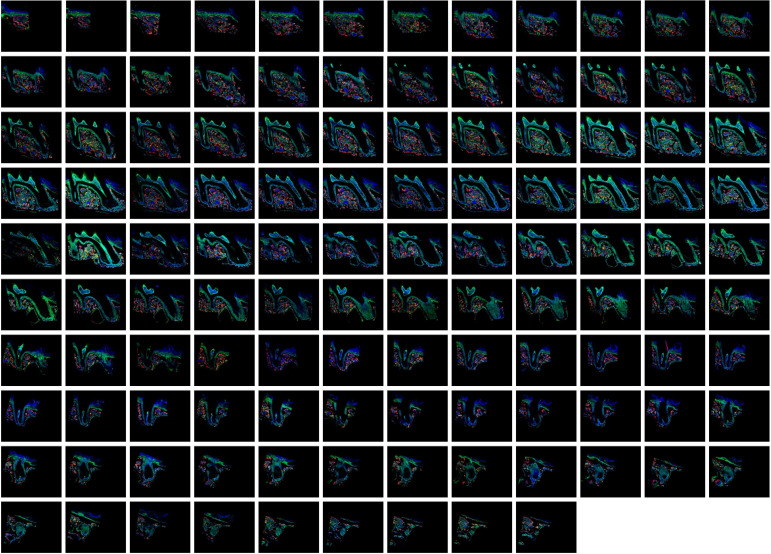
Figure 6—figure supplement 1. The total 117 slices of maxilla M1 of PdgfraCreER×Nfatc1DreER× LGRT mice sample (tracing).
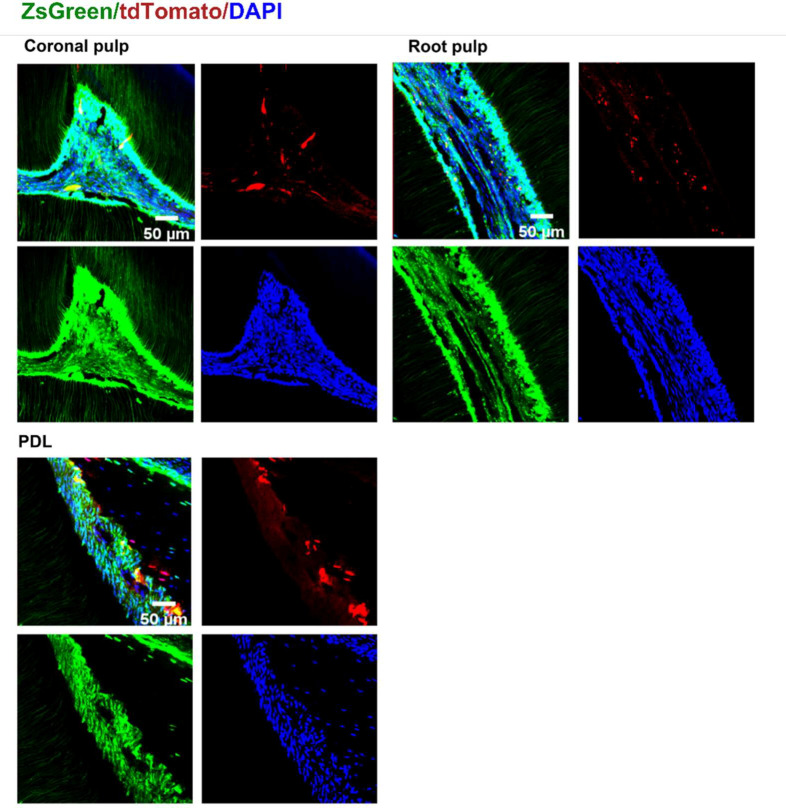
Figure 6—figure supplement 2. Representative images of coronal pulp, root pulp, and PDL of maxilla M1 of PdgfraCreER×Nfatc1DreER× LGRT mice sample (tracing).
Figure 6—figure supplement 3. The tdTomato signal in pulp of maxilla M1 of PdgfraCreER×Nfatc1DreER× LGRT mice sample (tracing) reconstructed by traditional serial section-based confocal imaging method (scale bar = 300 μm).
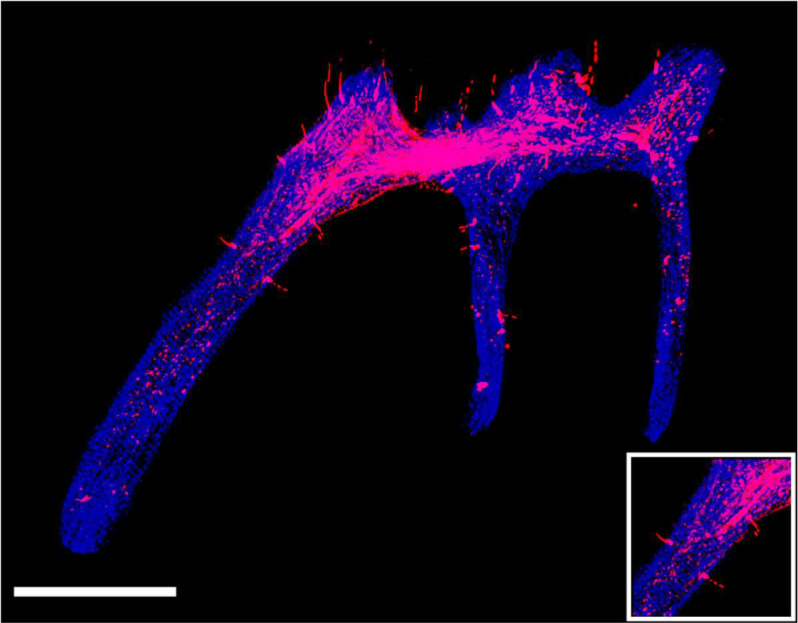
Figure 6—figure supplement 4. The discontinuities in the z-axis due to stratification of slices.
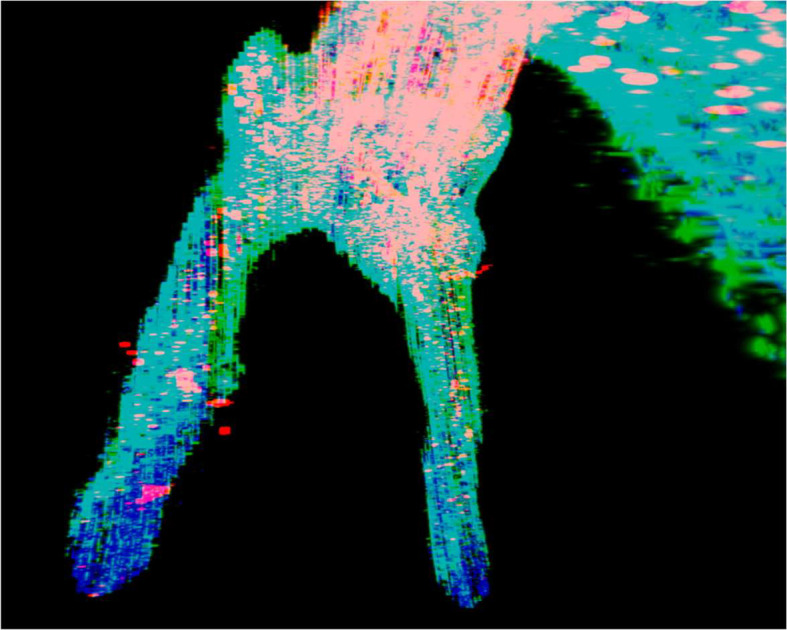
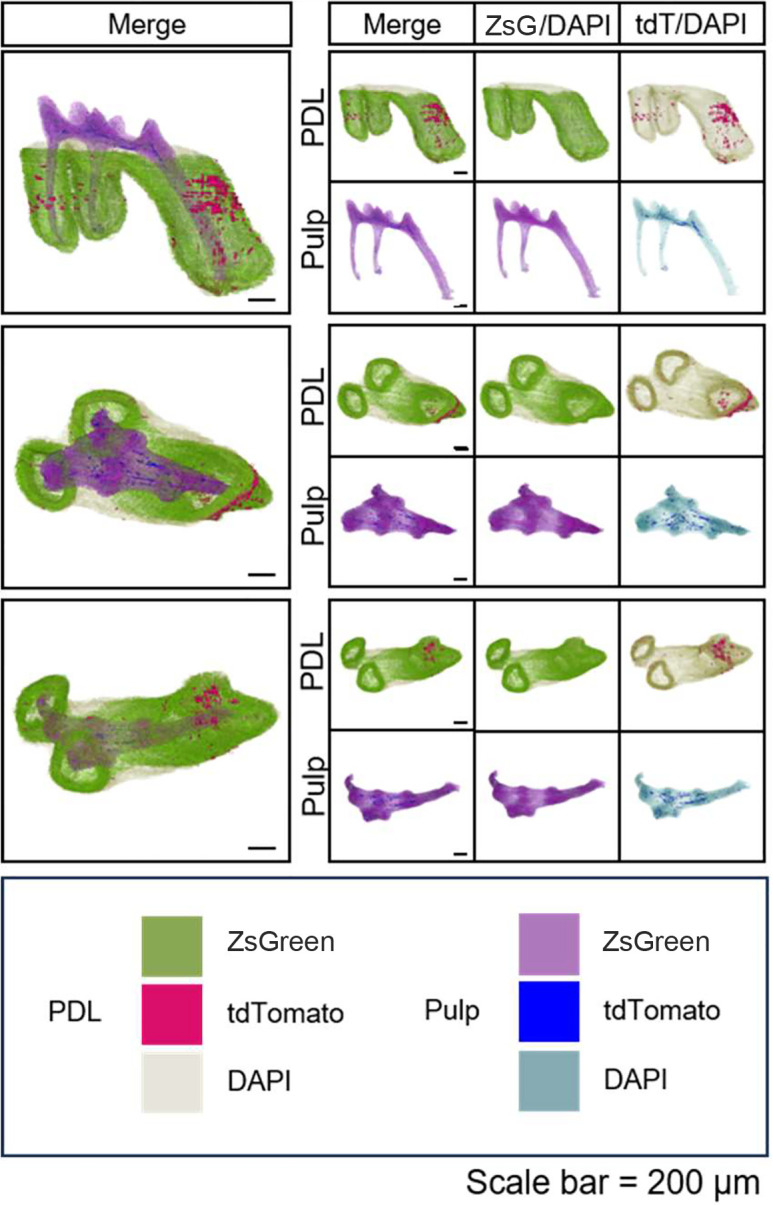
Figure 6—figure supplement 5. 3D reconstruction of maxilla M1 of PdgfraCreER×Nfatc1DreER× LGRT mice (tracing) by DICOM-3D; PDL: ZsGreen+ cells in green, tdTomato+ cells in rose red; pulp: ZsGreen+ cells in purple, tdTomato+ cells in blue.
