. 2024 Dec 20;13:RP100173. doi: 10.7554/eLife.100173

Figure 7. MCIR tracing distinct cell populations simultaneously in the pulp and PDL.

(A) Schematic illustration of pulse in PdgfraCreER×Nfatc1DreER× LGRT mice. (B) Operation process of frozen section. Using this procedure, a total of 120 slices were collected in this sample. (C) 3D reconstruction of mandible M1 using Imaris, including pulp and PDL with virtual dentin shell (white) (scale bar = 200 μm). The image stack was displayed in buccal view, coronal view, and radicular view of pulp and PDL, respectively. (D) 3D reconstruction of mandible M1 using DICOM-3D, in which the distribution of NFATc1+ cells in pulp and PDL tissues can be more precisely perceived (D-b), scale bar = 200 μm. (D-a): The legend of (D-b).

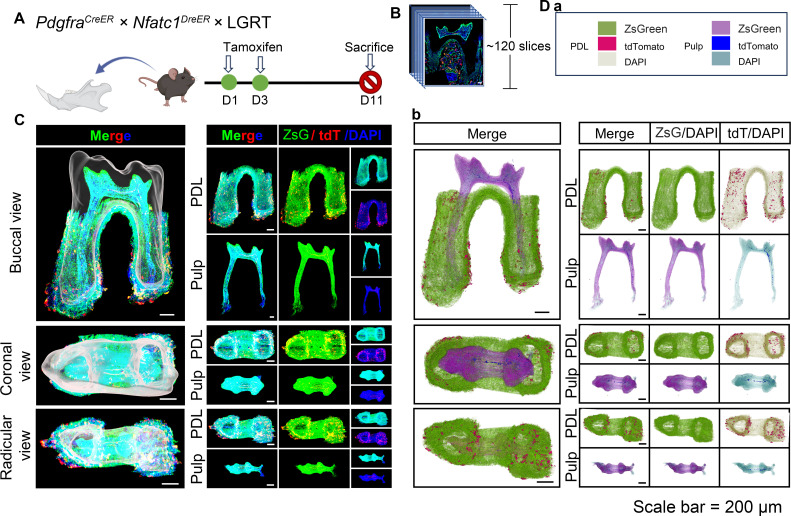
Figure 7.

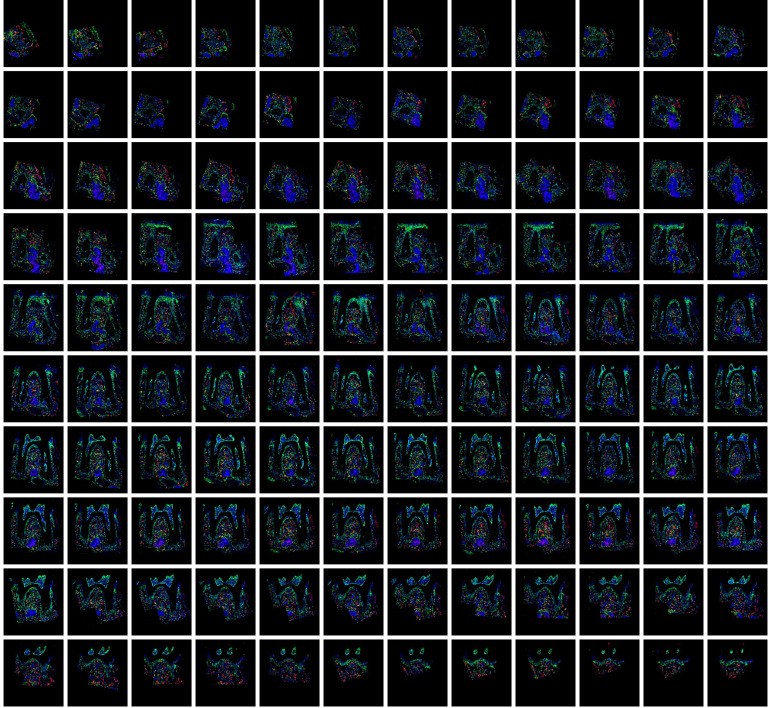
Figure 7—figure supplement 1. All consecutive slices (a total of 120 slices) for imaging of mandible M1 of PdgfraCreER×Nfatc1DreER× LGRT mice (tracing 11 days).

Figure 7—figure supplement 1.

The images were acquired by confocal microscope, ZsGreen+ cells in green, tdTomato+ cells in red, DAPI in blue.
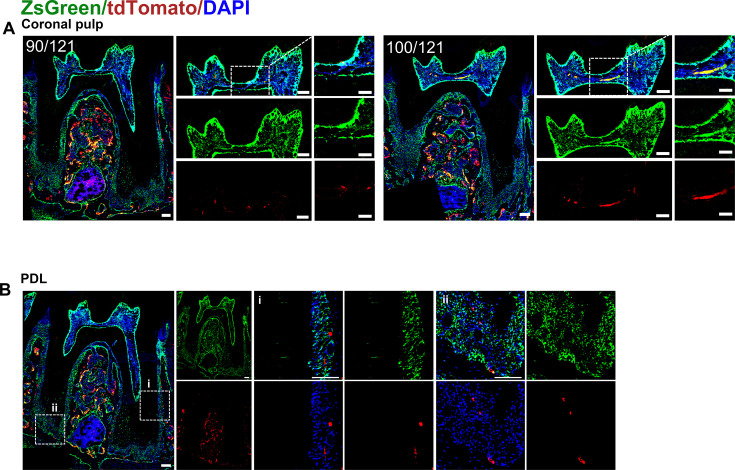
Figure 7—figure supplement 2. Representative images of coronal pulp (A) and PDL (B) acquired by confocal microscope of mandible M1 of PdgfraCreER×Nfatc1DreER× LGRT mice sample (tracing).

Figure 7—figure supplement 2.

Scale bar = 100 μm.
Figure 7—video 1. Panoptic multicolor imaging of ZsGreen+ cells (green) & tdTomato+ cells (red) in the pulp and PDL area mandible M1 of PdgfraCreER×Nfatc1DreER× LGRT mice (tracing 11 days), the whole-tissue imaging was reconstructed from serial sections, related to Figure 7C.
Download video file (4.1MB, mp4)
ZsGreen+ cells in green, tdTomato+ cells in red and DAPI in blue.