. 2024 Dec 20;13:RP100173. doi: 10.7554/eLife.100173

Figure 9. Ablation of PDGFR-α+ Cells Disrupts the morphology of dental pulp and periodontal ligament tissues.

(A) Schematics of tamoxifen induction. (B) Schematic diagram of the DTA working principle. (C, E) Representative H&E images of pulp (C) and PDL (E) of mandible M1 in PdgfraCreER ×DTA and control mice. (D, F) Masson trichrome staining of pulp (D) and PDL (F) of mandible M1 in PdgfraCreER ×DTA and control mice. Arrows in (C, D) indicate the odontoblast cell layer. Dotted lines in (E, F) outline ROI of the PDL. D: dentin; AB: alveolar bone. Scale bar: 50 μm.

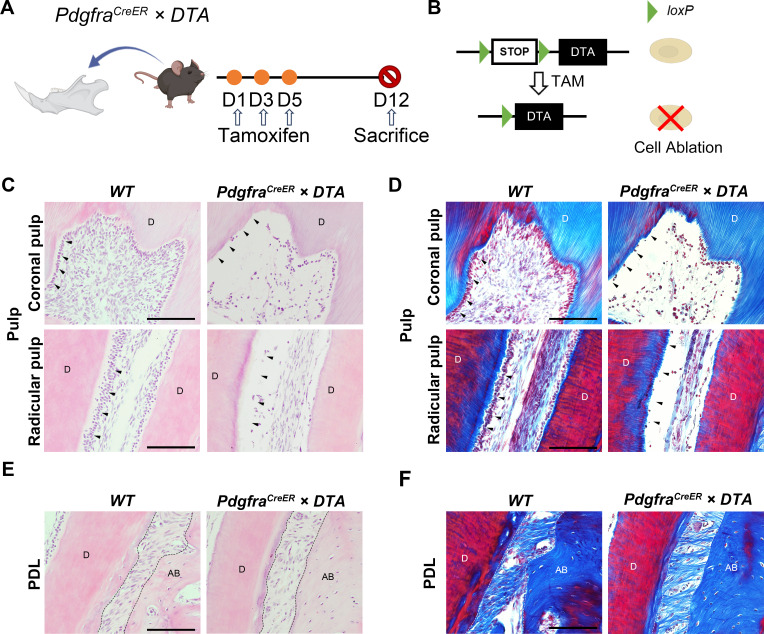
Figure 9.

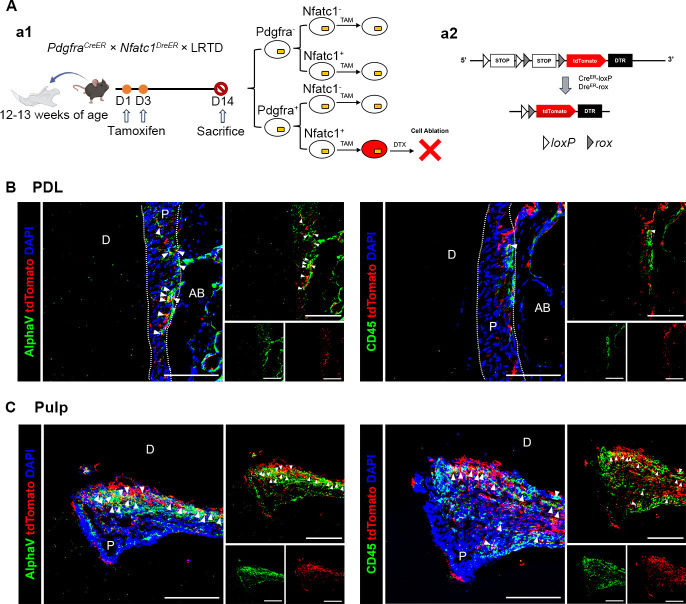
Figure 9—figure supplement 1. The identification of the types of PDGFR-α+ and NFATc1+ cells (red) of dental pulp and periodontal ligament tissues.

Figure 9—figure supplement 1.

(A) a1: Schematic illustration of lineaging tracing in PdgfraCreER×Nfatc1DreER× LRTD mice. a2: The mice were administrated with tamoxifen at D1 and D3, and sacrificed at D14. (B, C) Representative IF images of PDL (B) and pulp (C) of mandible M1 in PdgfraCreER×Nfatc1DreER× LRTD mice showing the MSCs marker AlphaV (left) and hematopoietic marker CD45 (right). Arrows in (B, C) indicate the co-localization of AlphaV/CD45 and tdTomato. D: dentin; AB: alveolar bone. P: PDL (B), pulp (C). Scale bar: 100 μm.