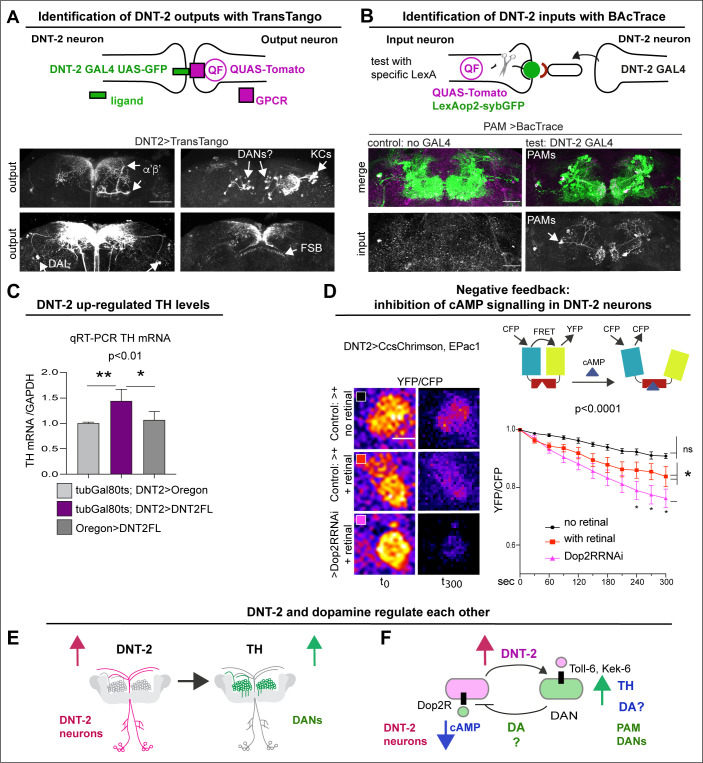
Figure 2. DNT-2 neurons are functionally connected to dopaminergic neurons.
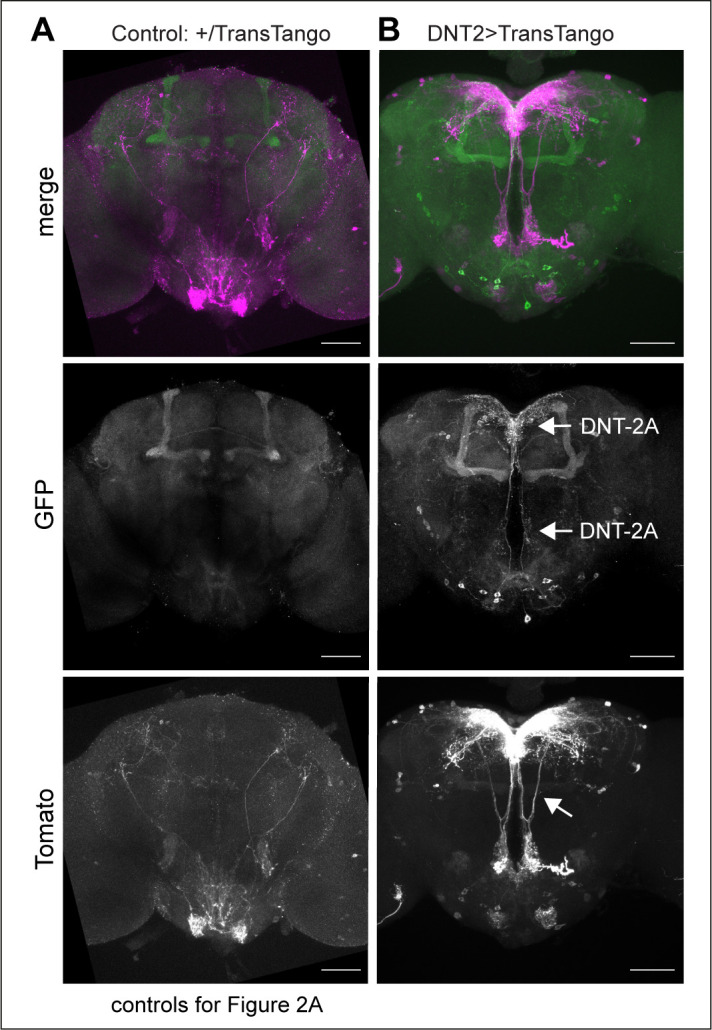
(A) TransTango revealed out-puts of DNT-2 neurons. All neurons express TransTango and expression of the TransTango ligand in DNT-2 neurons identified DNT-2 outputs with Tomato (anti-DsRed). TransTango identified as DNT-2 outputs KC α’β’ MB lobes (anterior brain, arrow, top left); Kenyon and possibly DAN cell bodies (posterior, arrows top right); DAL neurons (bottom left, arrows) and the dorsal layer of the fan shaped body (bottom right, arrow). See also Figure 2—figure supplement 1 for further controls. (B) BAcTrace tests connectivity to a candidate neuron input visualised with LexAop>sybGFP by driving the expression of a ligand from DNT-2GAL4 that will activate QUASTomato in the candidate input neuron (Cachero et al., 2020). Candidate PAM neurons visualised at SMP with GFP (green): Control: R58E02LexA>BAcTrace 806, no GAL4. Test: R58E02LexA, DNT-2GAL4>BAcTrace 806 revealed PAMs are inputs of DNT-2A neurons at SMP (Tomato, bottom). Magenta shows QUAS-Tomato. (C) qRT-PCR showing that TH mRNA levels increased with DNT-2 over-expression at 30°C (tubGAL80ts, DNT-2>DNT-2FL). One-way ANOVA, p=0.0085; post doc Dunnett’s multiple comparison test. Mean ± standard deviation (s.d.). n=4 (left), 5 (middle), 3 (right). (D) FRET cAMP probe Epac1 revealed that DNT-2>Dop2R-RNAi knock-down decreased YFP/CFP ratio over time in DNT-2A neurons, meaning that cAMP levels increased. Two-way ANOVA, genotype factor p<0.0001, time factor p<0.0001; post doc Dunnett’s. Mean ±s.d. n=9,12,17. (E, F) Summary: DNT-2 neurons and DANs are functionally connected and modulate each other. (E) DNT-2 can induce TH expression in DANs; (F) this is followed by negative feedback from DANs to DNT-2 neurons (question marks indicate inferences). TH: tyrosine hydroxylase. Scale bars: (A) 50 µm; (B) 30 µm; (D) 20 µm. p-Values over graphs in (C) refer to group analyses; stars indicate multiple comparisons tests. *p<0.05, **p<0.01, ***p<0.001. For sample sizes and further statistical details, see Supplementary file 2.
Figure 2—figure supplement 1. TransTango connectivity controls.


